캐글 타이타닉으로 어디까지 갈 수 있을까 - 기본편

2024/03/26: 초안 작성일; 머리말, 요약, 본문 코드, 이미지 완성(상세 설명 제외)
2024/04/17: 이미지 오류 수정
2024/04/21: 이미지 오류 수정 완료
목차
머리말
- 이 글은 캐글에서 가장 유명, 입문용인 Titanic - Machine Learning from Disaster 제출한 것을 정리한 글
- 캐글 타이타닉으로 어디까지 깊게 공부할 수 있을지 끝까지 가볼 예정
- 입문용이라지만 깊게 들어갈수록 공부할 내용은 많음.
- 데이터셋에 대한 이해를 바탕으로 공부한 내용을 최대한 확장하고 심화할 것
- 사용하고 있는 노트북의 성능 한계로 Web based JupyterLab을 활용함.
이번 공부의 목적
- 단순 필사가 아닌, 문제가 생기면 스스로 해결
- 라이브러리들의 Documentation를 하나씩 확인하며 파라미터들을 이해하고, 사용법을 정확히 익히기.
- EDA, 전처리, 모델링의 아이디어, 논리, 기법 이해 및 숙달
- 아무 것도 참고하지 않고 스스로 작성할 수 있을 정도로 반복
향후 정리하고 확장할 사항
- Kaggle - Titanic (심화)에선 유명한 Tutorials 등을 참고하여 Null 값 처리, String → Numerical, Binning, Modeling 등 세부 방법들을 비교, List화하고, 정리
- 모델링에 사용한 sklearn의 RandomForestClassifier 소스코드(위치 확인 완료)를 분석하여 어떤 로직으로 구현하는지 분석
- 각 메서드의 kwargs들을 익히기 위해 라이브러리들의 기본이 되는 메서드, 파라미터들을 익히고 정리
- ipynb 파일을 효율적으로 Markdown이나 HTML로 Export, 변환하는 방법, 자동화 등 모색
요약
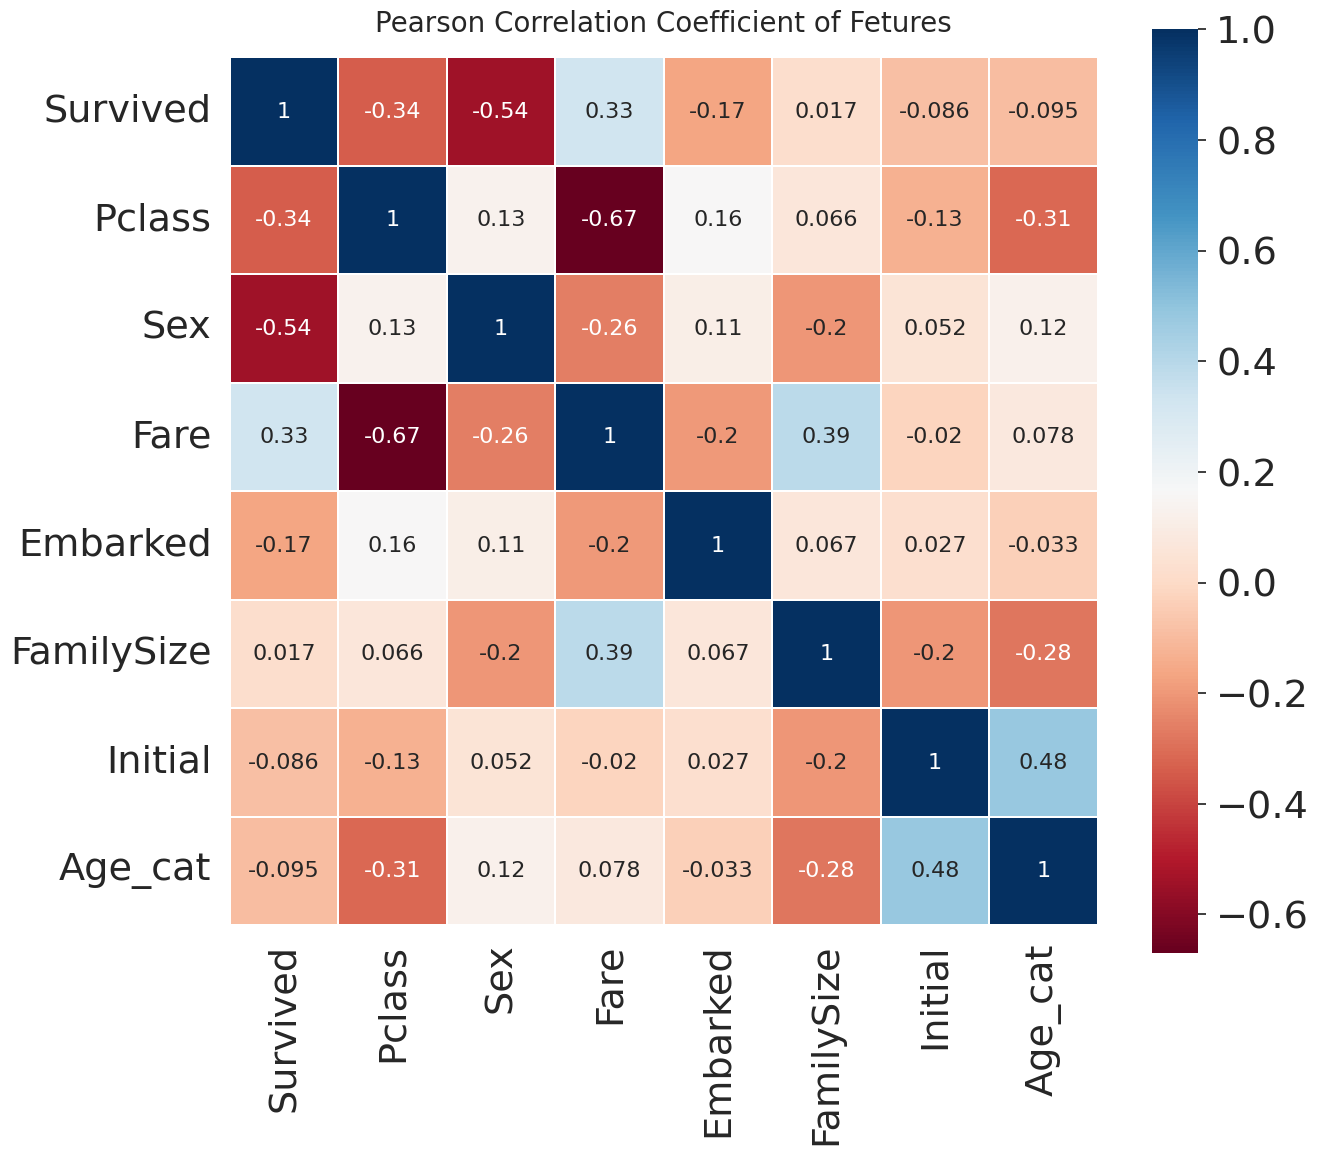
Feature들의 피어슨 상관계수 Heatmap
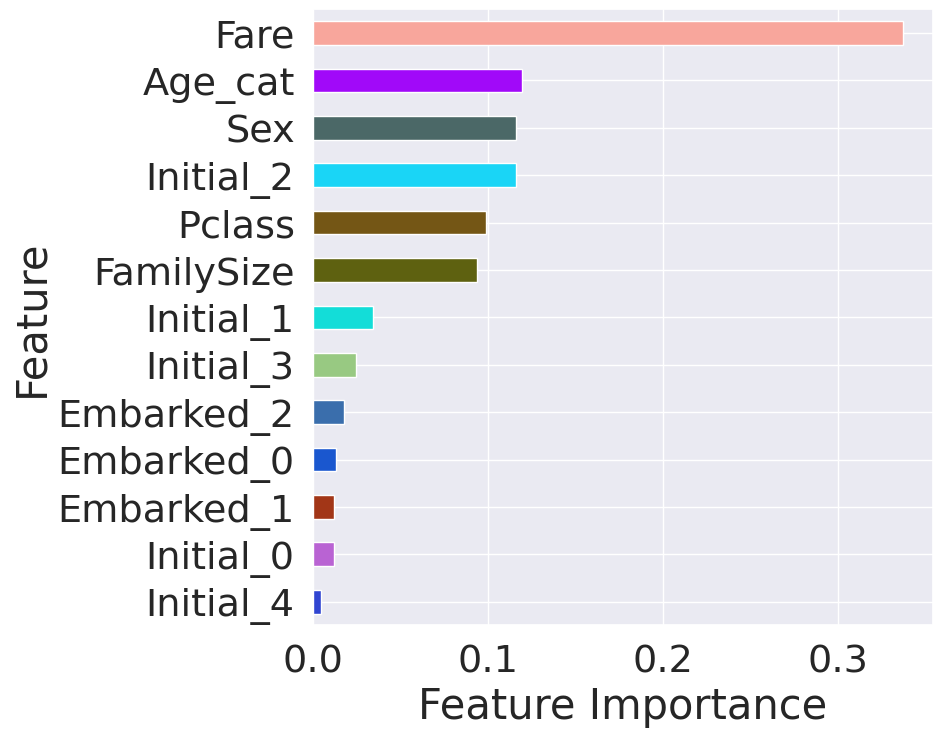
Feature Importance순으로 Horizontal Bar
EDA와 Feature Engineering
- Feature로 Fare, Age, Sex, Name Pronouns(Initial), Passenger Class (Pclass), Family Size(Family Size), Embaked를 사용함.
- Fare는 Log를 취하고, Initial와 Embaked String을 Numeric으로, Age는 Binning하여 Numeric으로, Family Size는 Sibling, Spouse, Parent, Child 데이터를 Passenger ID를 기준으로 계산
Random Forest Classifier로 만든 Classification 모델의 성능
Classification Report
precision recall f1-score support 0 0.85 0.88 0.87 172 1 0.78 0.72 0.75 96 accuracy 0.82 268 macro avg 0.81 0.8 0.81 268 weighted avg 0.82 0.82 0.82 268
본문
1
2
3
4
5
6
7
8
9
10
11
12
13
14
15
16
17
18
19
20
21
22
23
24
25
26
27
import piplite

import pandas as pd
import numpy as np
import matplotlib.pyplot as plt

await piplite.install('seaborn')
import seaborn as sns

await piplite.install('plotly')
import plotly.offline as py
py.init_notebook_mode(connected=True)
import plotly.graph_objs as go
import plotly.tools as tls

plt.style.use('seaborn')
sns.set_theme(font_scale=2.5)
import jinja2

await piplite.install('missingno')
import missingno as msno

import warnings
warnings.filterwarnings('ignore')

%matplotlib inline
%config Completer.use_jedi = False
1
2
df_train = pd.read_csv('../data/titanic/train.csv')
df_test = pd.read_csv('../data/titanic/test.csv')
1
df_train.head()
| PassengerId | Survived | Pclass | Name | Sex | Age | SibSp | Parch | Ticket | Fare | Cabin | Embarked | |
|---|---|---|---|---|---|---|---|---|---|---|---|---|
| 0 | 1 | 0 | 3 | Braund, Mr. Owen Harris | male | 22.0 | 1 | 0 | A/5 21171 | 7.2500 | NaN | S |
| 1 | 2 | 1 | 1 | Cumings, Mrs. John Bradley (Florence Briggs Th... | female | 38.0 | 1 | 0 | PC 17599 | 71.2833 | C85 | C |
| 2 | 3 | 1 | 3 | Heikkinen, Miss. Laina | female | 26.0 | 0 | 0 | STON/O2. 3101282 | 7.9250 | NaN | S |
| 3 | 4 | 1 | 1 | Futrelle, Mrs. Jacques Heath (Lily May Peel) | female | 35.0 | 1 | 0 | 113803 | 53.1000 | C123 | S |
| 4 | 5 | 0 | 3 | Allen, Mr. William Henry | male | 35.0 | 0 | 0 | 373450 | 8.0500 | NaN | S |
1
df_train.describe()
| PassengerId | Survived | Pclass | Age | SibSp | Parch | Fare | |
|---|---|---|---|---|---|---|---|
| count | 891.000000 | 891.000000 | 891.000000 | 714.000000 | 891.000000 | 891.000000 | 891.000000 |
| mean | 446.000000 | 0.383838 | 2.308642 | 29.699118 | 0.523008 | 0.381594 | 32.204208 |
| std | 257.353842 | 0.486592 | 0.836071 | 14.526497 | 1.102743 | 0.806057 | 49.693429 |
| min | 1.000000 | 0.000000 | 1.000000 | 0.420000 | 0.000000 | 0.000000 | 0.000000 |
| 25% | 223.500000 | 0.000000 | 2.000000 | 20.125000 | 0.000000 | 0.000000 | 7.910400 |
| 50% | 446.000000 | 0.000000 | 3.000000 | 28.000000 | 0.000000 | 0.000000 | 14.454200 |
| 75% | 668.500000 | 1.000000 | 3.000000 | 38.000000 | 1.000000 | 0.000000 | 31.000000 |
| max | 891.000000 | 1.000000 | 3.000000 | 80.000000 | 8.000000 | 6.000000 | 512.329200 |
1
df_test.describe()
| PassengerId | Pclass | Age | SibSp | Parch | Fare | |
|---|---|---|---|---|---|---|
| count | 418.000000 | 418.000000 | 332.000000 | 418.000000 | 418.000000 | 417.000000 |
| mean | 1100.500000 | 2.265550 | 30.272590 | 0.447368 | 0.392344 | 35.627188 |
| std | 120.810458 | 0.841838 | 14.181209 | 0.896760 | 0.981429 | 55.907576 |
| min | 892.000000 | 1.000000 | 0.170000 | 0.000000 | 0.000000 | 0.000000 |
| 25% | 996.250000 | 1.000000 | 21.000000 | 0.000000 | 0.000000 | 7.895800 |
| 50% | 1100.500000 | 3.000000 | 27.000000 | 0.000000 | 0.000000 | 14.454200 |
| 75% | 1204.750000 | 3.000000 | 39.000000 | 1.000000 | 0.000000 | 31.500000 |
| max | 1309.000000 | 3.000000 | 76.000000 | 8.000000 | 9.000000 | 512.329200 |
1
2
3
for col in df_train.columns:
    msg = 'column: {:>10}\t Percent of NaN value: {:.2f}%'.format(col, 100 * (df_train[col].isnull().sum() / df_train[col].shape[0]))
    print(msg)
1
2
3
4
5
6
7
8
9
10
11
12
column: PassengerId	 Percent of NaN value: 0.00%
column:   Survived	 Percent of NaN value: 0.00%
column:     Pclass	 Percent of NaN value: 0.00%
column:       Name	 Percent of NaN value: 0.00%
column:        Sex	 Percent of NaN value: 0.00%
column:        Age	 Percent of NaN value: 19.87%
column:      SibSp	 Percent of NaN value: 0.00%
column:      Parch	 Percent of NaN value: 0.00%
column:     Ticket	 Percent of NaN value: 0.00%
column:       Fare	 Percent of NaN value: 0.00%
column:      Cabin	 Percent of NaN value: 77.10%
column:   Embarked	 Percent of NaN value: 0.22%
1
2
3
for col in df_test.columns:
    msg = 'column: {:>10}\t Percent of NaN value: {:.2f}%'.format(col, 100 * (df_test[col].isnull().sum() / df_test[col].shape[0]))
    print(msg)
1
2
3
4
5
6
7
8
9
10
11
column: PassengerId	 Percent of NaN value: 0.00%
column:     Pclass	 Percent of NaN value: 0.00%
column:       Name	 Percent of NaN value: 0.00%
column:        Sex	 Percent of NaN value: 0.00%
column:        Age	 Percent of NaN value: 20.57%
column:      SibSp	 Percent of NaN value: 0.00%
column:      Parch	 Percent of NaN value: 0.00%
column:     Ticket	 Percent of NaN value: 0.00%
column:       Fare	 Percent of NaN value: 0.24%
column:      Cabin	 Percent of NaN value: 78.23%
column:   Embarked	 Percent of NaN value: 0.00%
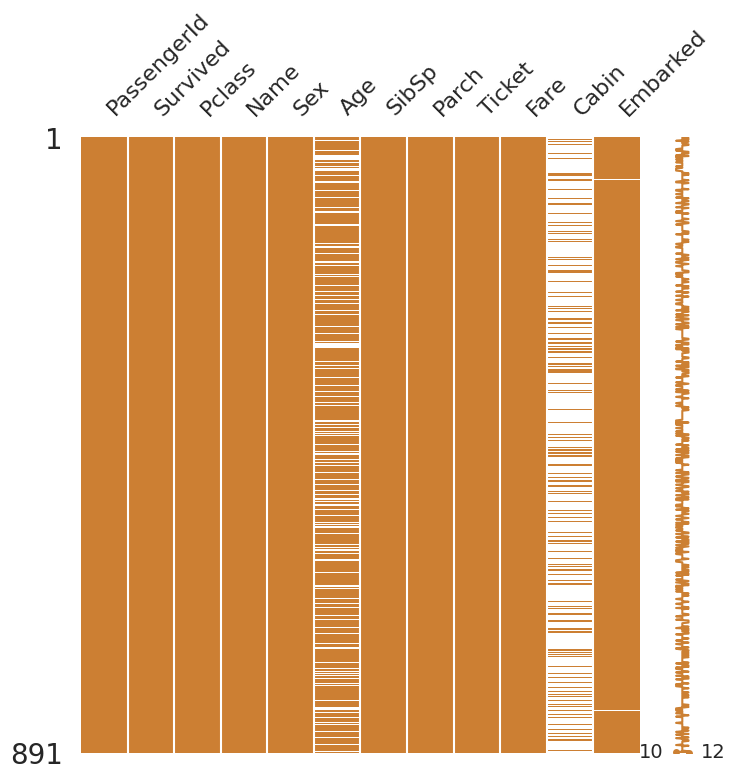
1
msno.matrix(df=df_train.iloc[:, :], figsize=(8, 8), color=(0.8, 0.5, 0.2))
1
<AxesSubplot:>
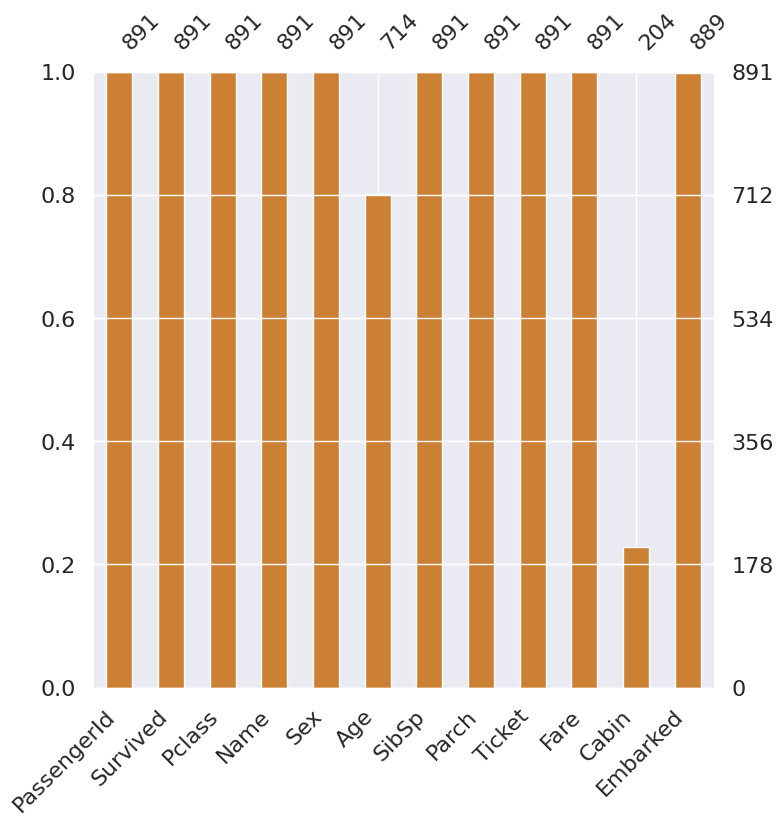
1
msno.bar(df=df_train.iloc[:, :], figsize=(8, 8), color=(0.8, 0.5, 0.2))
1
<AxesSubplot:>
1
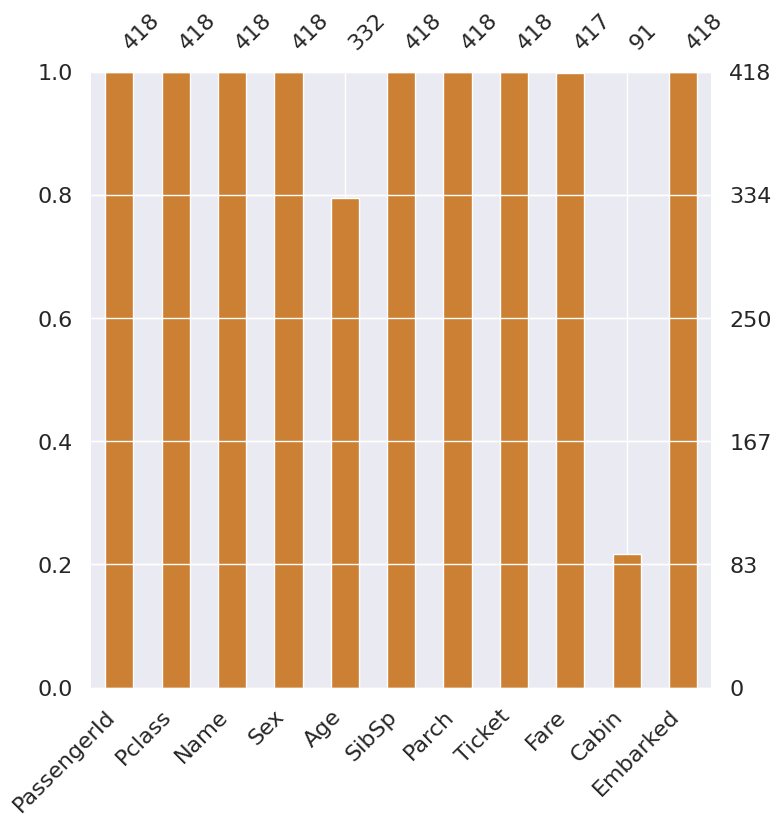
msno.bar(df=df_test.iloc[:, :], figsize=(8, 8), color=(0.8, 0.5, 0.2))
1
<AxesSubplot:>
1
2
3
4
5
6
7
8
9
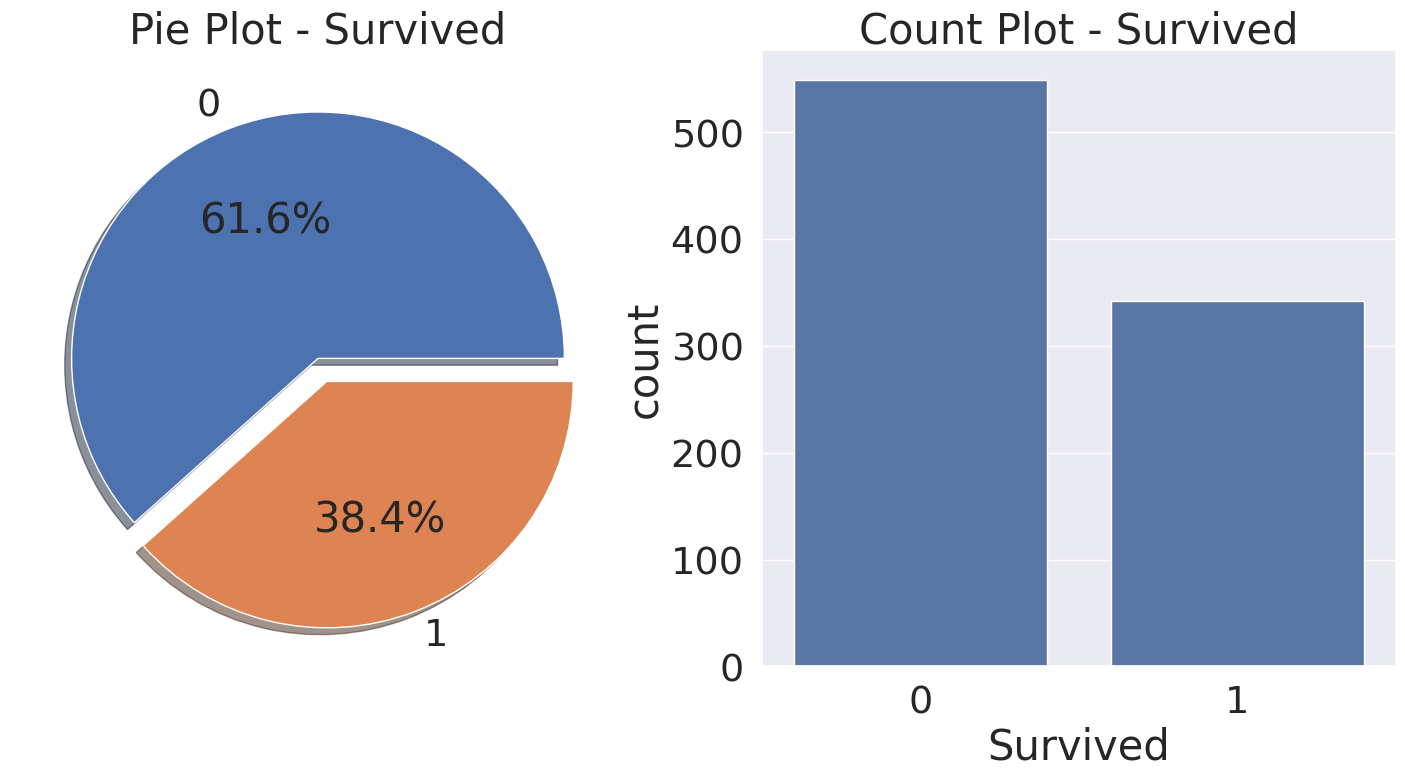
fig, ax = plt.subplots(1, 2, figsize=(18, 8))
df_train['Survived'].value_counts().plot.pie(explode=[0, 0.1], autopct='%1.1f%%', ax=ax[0], shadow=True)
ax[0].set_title('Pie Plot - Survived')
ax[0].set_ylabel('')
sns.countplot(x='Survived', data=df_train, ax=ax[1])
ax[1].set_title('Count Plot - Survived')
plt.show()
1
df_train[['Pclass', 'Survived']].groupby(['Pclass']).count()
| Survived | |
|---|---|
| Pclass | |
| 1 | 216 |
| 2 | 184 |
| 3 | 491 |
1
df_train[['Pclass', 'Survived']].groupby(['Pclass']).sum()
| Survived | |
|---|---|
| Pclass | |
| 1 | 136 |
| 2 | 87 |
| 3 | 119 |
1
pd.crosstab(df_train['Pclass'], df_train['Survived'], margins=True).style.background_gradient(cmap='summer_r')
| Survived | 0 | 1 | All |
|---|---|---|---|
| Pclass | |||
| 1 | 80 | 136 | 216 |
| 2 | 97 | 87 | 184 |
| 3 | 372 | 119 | 491 |
| All | 549 | 342 | 891 |
1
2
3
4
5
6
7
8
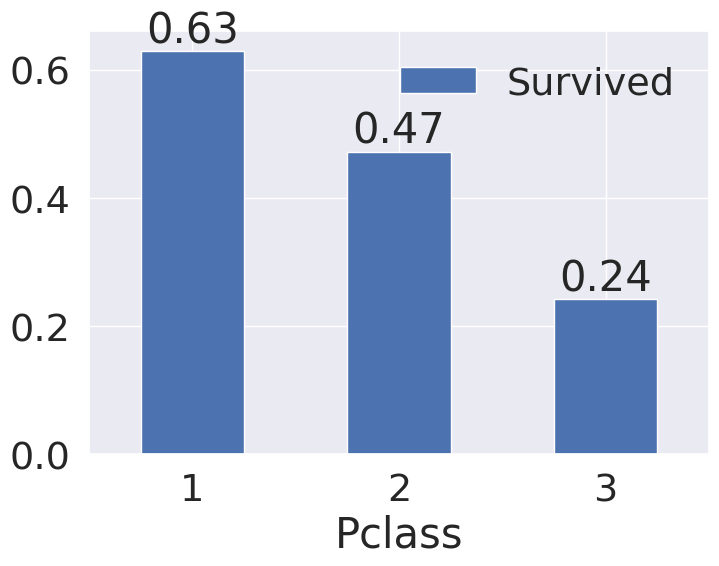
df_train[['Pclass', 'Survived']].groupby(['Pclass']).mean().sort_values(by='Survived', ascending=False).plot.bar()
plt.xticks(rotation=0)
Pclass_data = df_train[['Pclass', 'Survived']].groupby(['Pclass']).mean().sort_values(by='Survived', ascending=False)
for index, value in enumerate(Pclass_data['Survived']):
plt.text(index, value, str(round(value, 2)), ha='center', va='bottom')
plt.show()
1
2
3
4
5
6
7
8
9
10
11
12
13
y_position = 1.02
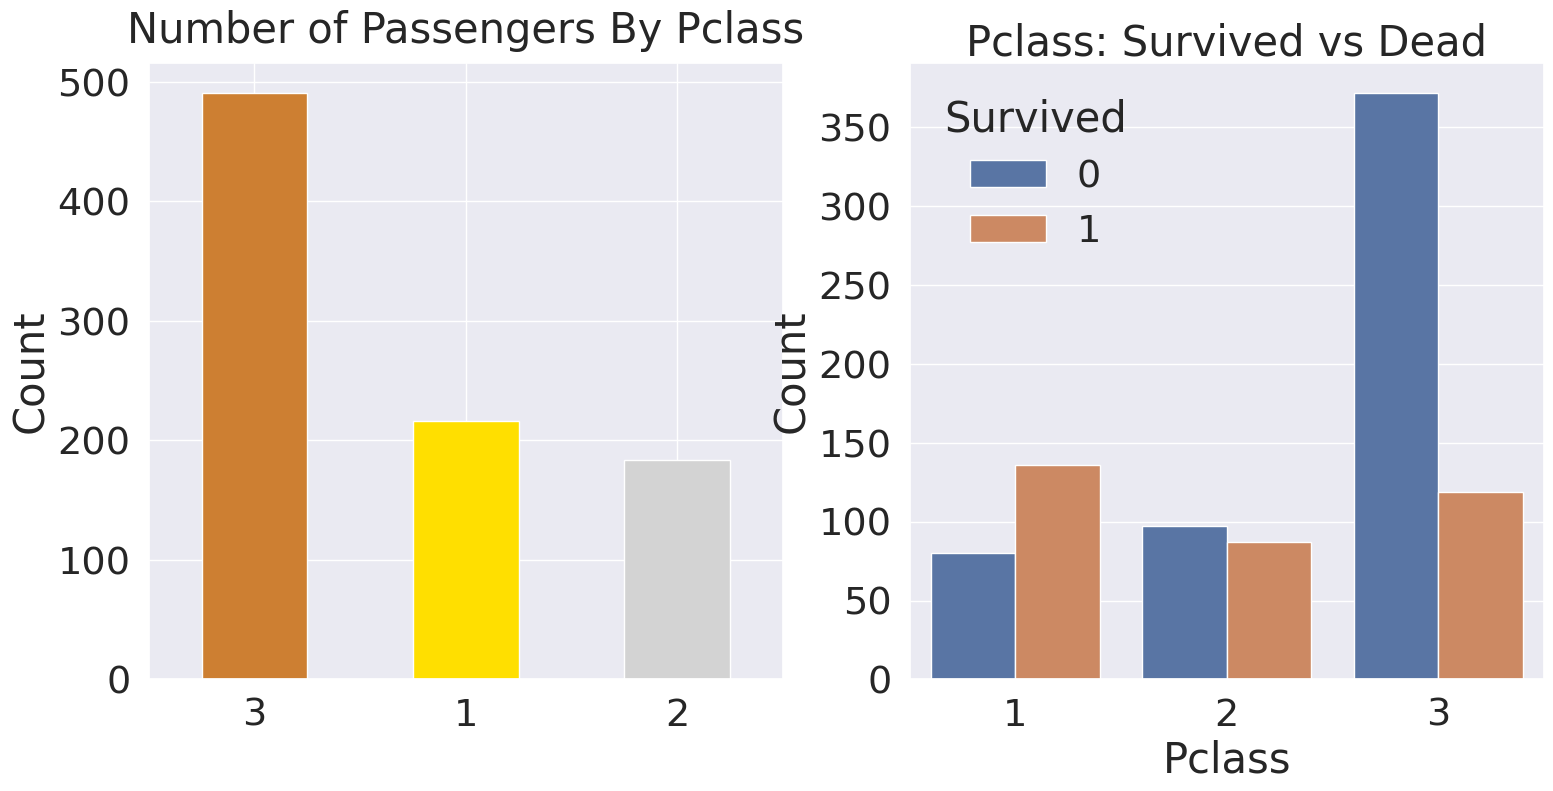
fig, ax = plt.subplots(1, 2, figsize=(18, 8))
df_train['Pclass'].value_counts().plot.bar(color=['#CD7F32', '#FFDF00', '#D3D3D3'], ax=ax[0])
ax[0].set_title('Number of Passengers By Pclass', y=y_position)
ax[0].set_ylabel('Count')
ax[0].set_xticklabels(ax[0].get_xticklabels(), rotation=0)
sns.countplot(x='Pclass', hue='Survived', data=df_train, ax=ax[1])
ax[1].set_title('Pclass: Survived vs Dead')
ax[1].set_ylabel('Count')
plt.show()
1
2
3
4
5
6
7
8
9
10
11
12
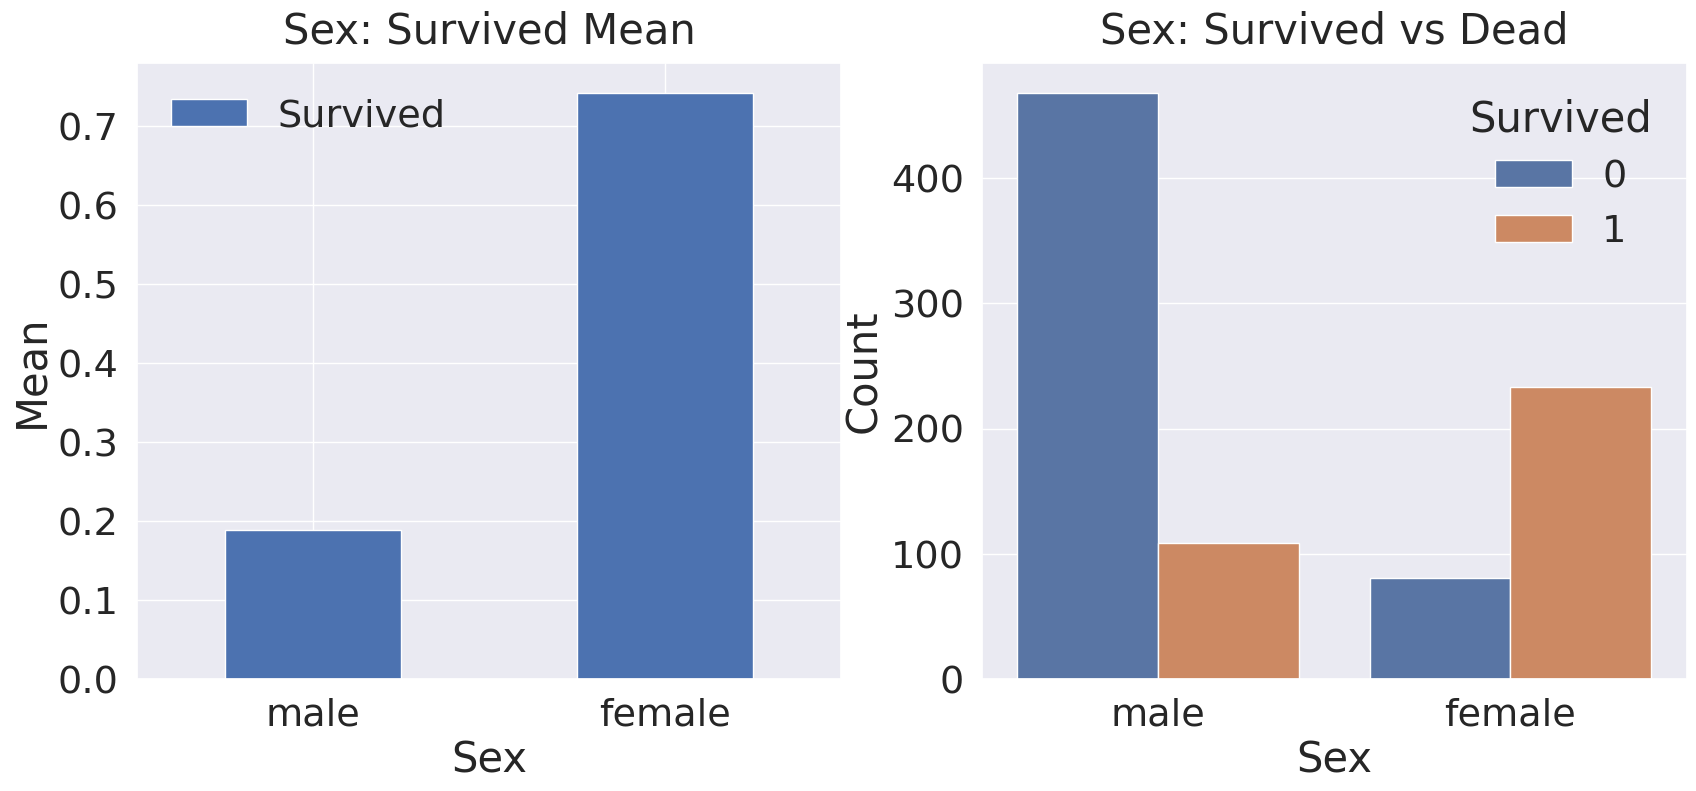
fig, ax = plt.subplots(1, 2, figsize=(20, 8))
df_train[['Sex', 'Survived']].groupby(['Sex']).mean().sort_values(by='Sex', ascending=False).plot.bar(ax=ax[0])
ax[0].set_title('Sex: Survived Mean', y=1.02)
ax[0].set_ylabel('Mean')
ax[0].set_xticklabels(ax[0].get_xticklabels(), rotation=0)
sns.countplot(x='Sex', hue='Survived', data=df_train, ax=ax[1])
ax[1].set_title('Sex: Survived vs Dead', y=1.02)
ax[1].set_ylabel('Count')
plt.show()
1
df_train[['Sex', 'Survived']].groupby(['Sex'], as_index=False).mean().sort_values(by='Survived', ascending=False)
| Sex | Survived | |
|---|---|---|
| 0 | female | 0.742038 |
| 1 | male | 0.188908 |
1
pd.crosstab(df_train['Sex'], df_train['Survived'], margins=True).style.background_gradient(cmap='summer_r')
| Survived | 0 | 1 | All |
|---|---|---|---|
| Sex | |||
| female | 81 | 233 | 314 |
| male | 468 | 109 | 577 |
| All | 549 | 342 | 891 |
1
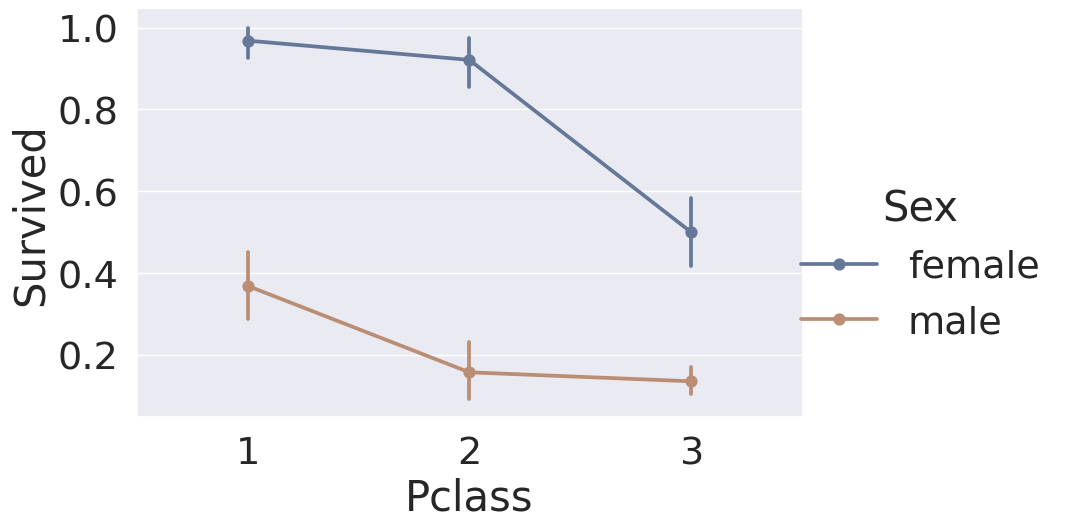
sns.catplot(data=df_train, x='Pclass', y='Survived', hue='Sex', height=6, kind='point', saturation=.5, aspect=1.5)
1
<seaborn.axisgrid.FacetGrid at 0xbc20158>
1
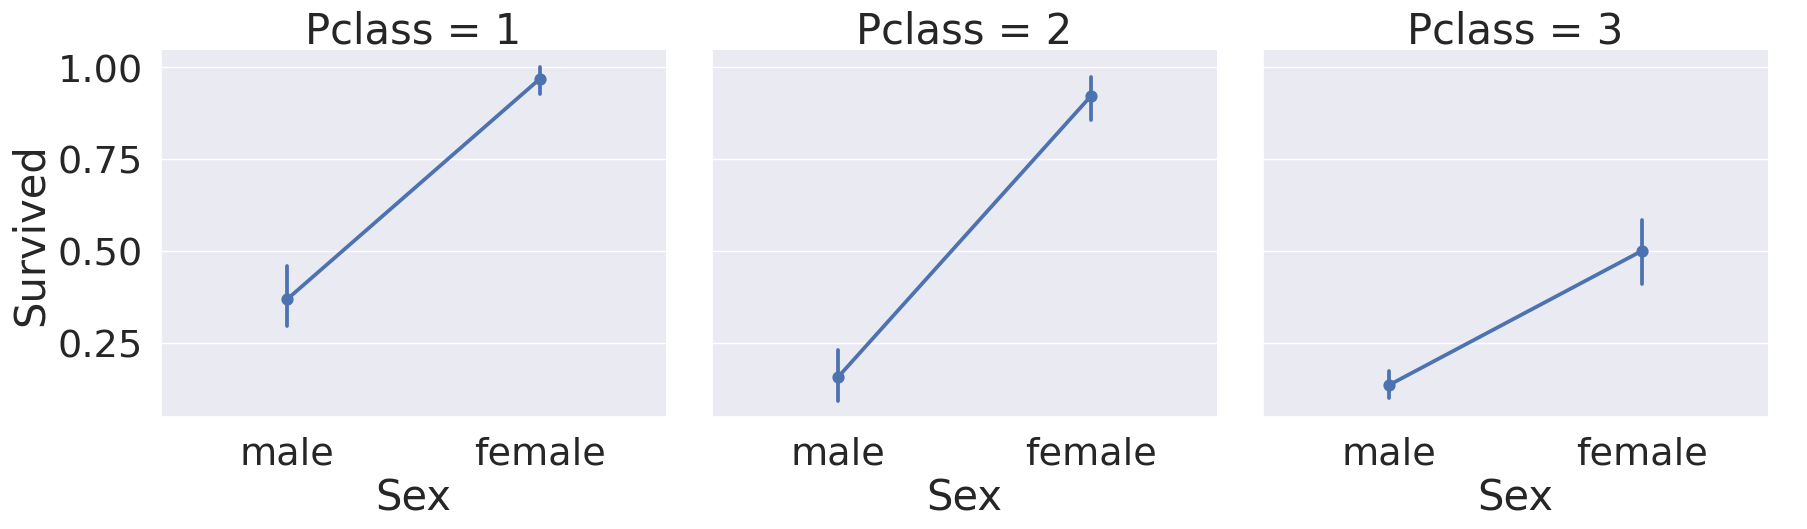
sns.catplot(data=df_train, x='Sex', y='Survived', col='Pclass', kind='point', height=6, aspect=1)
1
<seaborn.axisgrid.FacetGrid at 0xba6afb0>
1
2
3
print('Oldest Passenger: {:.1f} Years'.format(df_train['Age'].max()))
print('Youngest Passenger: {:.1f} Years'.format(df_train['Age'].min()))
print('Mean Age: {:.1f}'.format(df_train['Age'].mean()))
1
2
3
Oldest Passenger: 80.0 Years
Youngest Passenger: 0.4 Years
Mean Age: 29.7
1
2
3
4
5
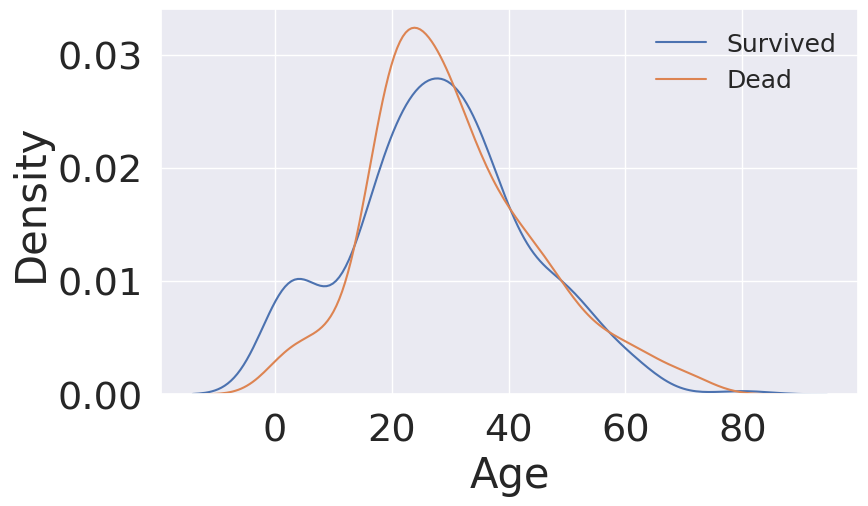
fig, ax = plt.subplots(1, 1, figsize=(9, 5))
sns.kdeplot(df_train[df_train['Survived'] == 1]['Age'], ax=ax)
sns.kdeplot(df_train[df_train['Survived'] == 0]['Age'], ax=ax)
plt.legend(['Survived', 'Dead'], fontsize=18)
plt.show()
1
2
3
4
5
6
7
8
9
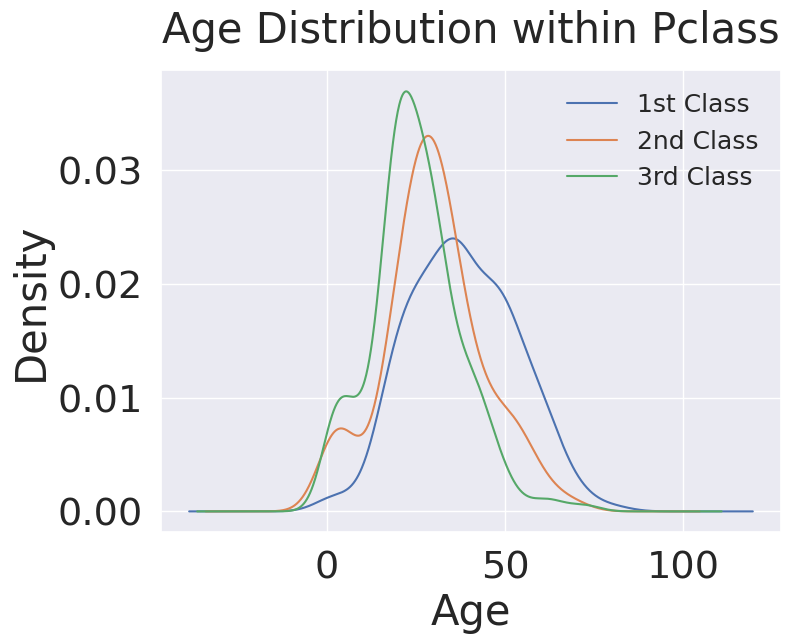
# Age distribution withing classes
plt.figure(figsize=(8, 6))
df_train['Age'][df_train['Pclass'] == 1].plot(kind='kde')
df_train['Age'][df_train['Pclass'] == 2].plot(kind='kde')
df_train['Age'][df_train['Pclass'] == 3].plot(kind='kde')
plt.xlabel('Age')
plt.title('Age Distribution within Pclass', pad=20)
plt.legend(['1st Class', '2nd Class', '3rd Class'], fontsize=18)
1
<matplotlib.legend.Legend at 0x18380ba8>
1
2
3
4
5
6
7
8
9
10
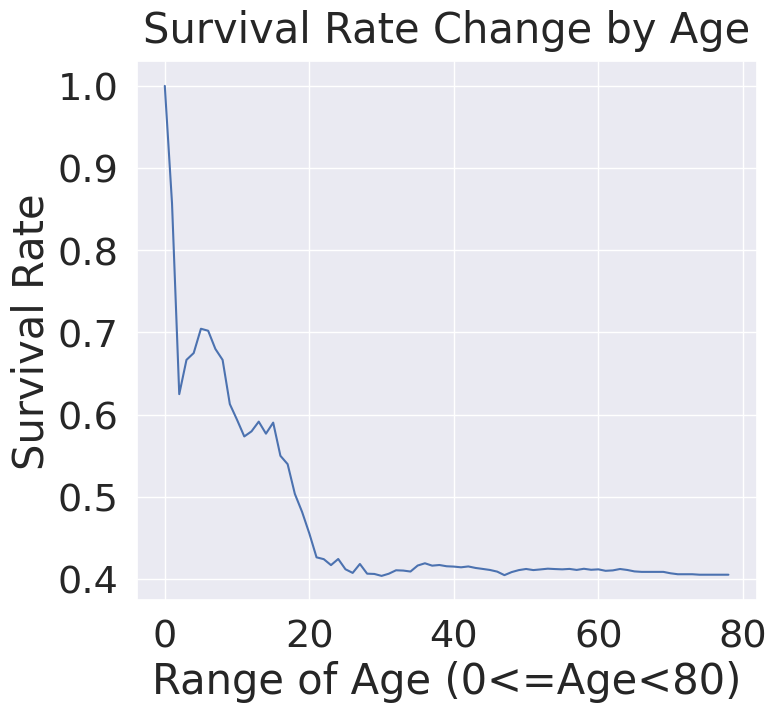
cummulate_survival_ratio = []
for i in range(1, 80):
cummulate_survival_ratio.append(df_train[df_train['Age'] < i]['Survived'].sum() / len(df_train[df_train['Age'] < i]['Survived']))
plt.figure(figsize=(8, 7))
plt.plot(cummulate_survival_ratio)
plt.title('Survival Rate Change by Age', y=1.02)
plt.xlabel('Range of Age (0<=Age<80)')
plt.ylabel('Survival Rate')
plt.show()
1
2
3
4
5
6
7
8
9
10
11
12
13
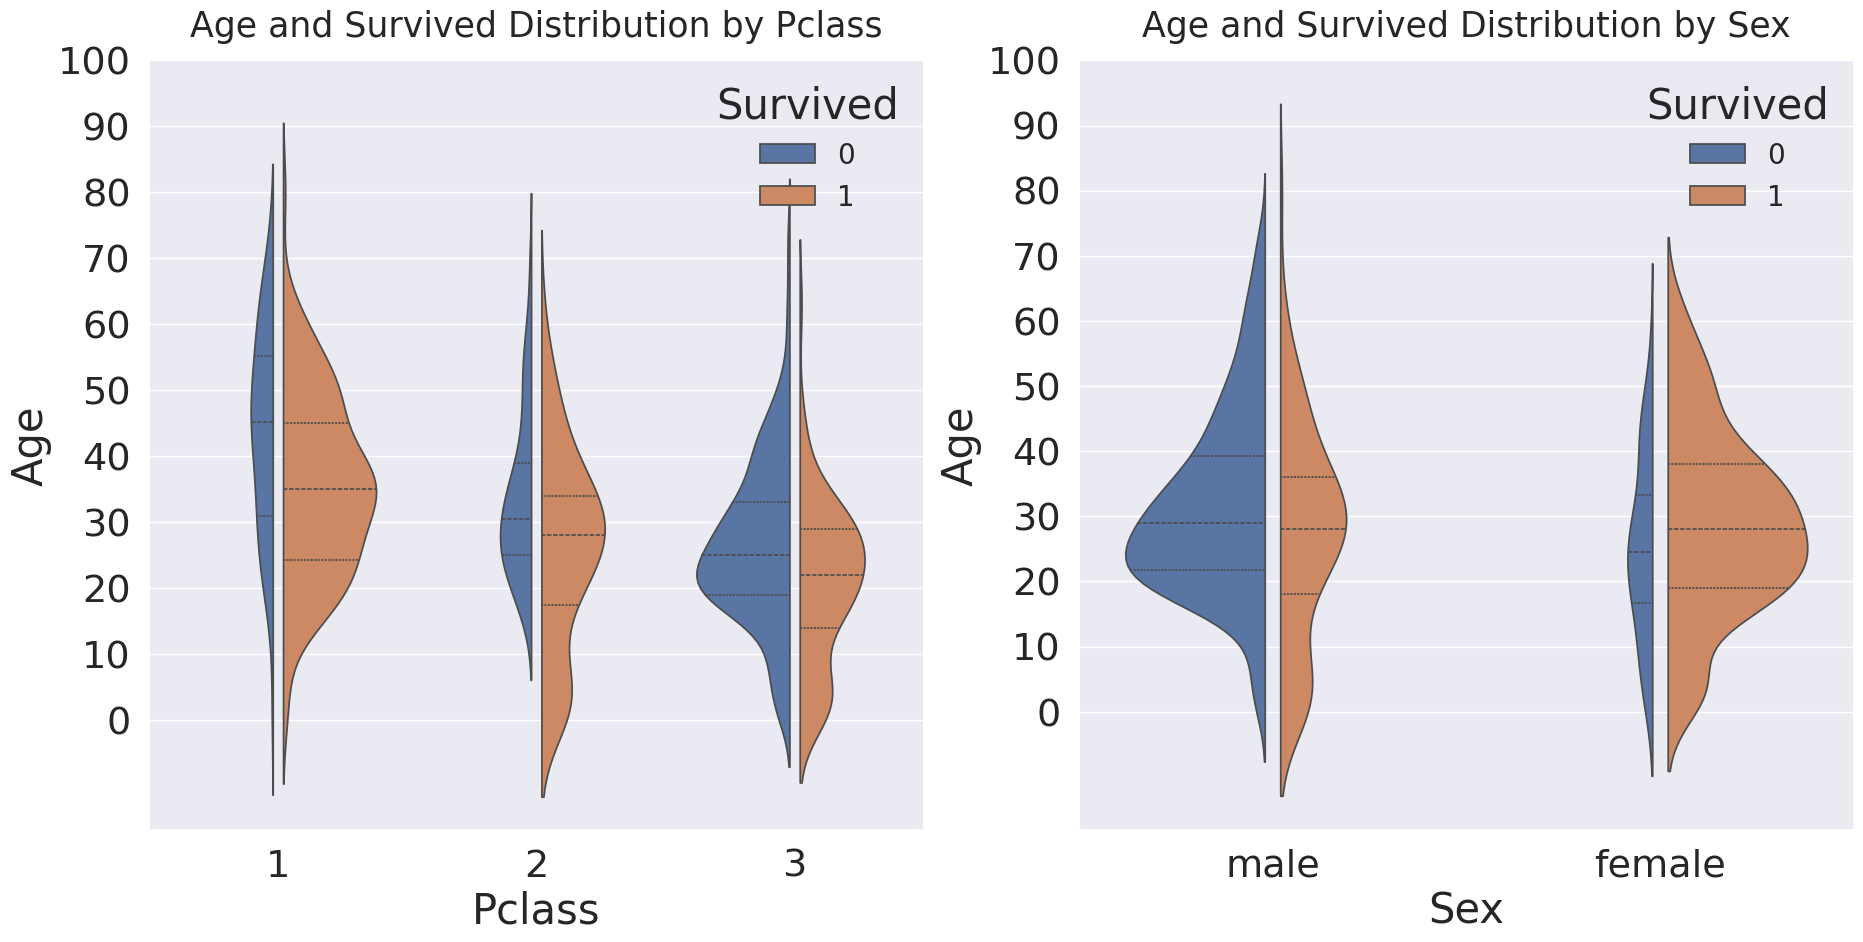
fig, ax = plt.subplots(1, 2, figsize=(22, 10))
sns.violinplot(data=df_train, x='Pclass', y='Age', hue='Survived', density_norm='count', split=True, gap=.1, inner='quart', ax=ax[0])
ax[0].set_title('Age and Survived Distribution by Pclass', fontsize=25, y=1.02)
ax[0].set_yticks(range(0, 110, 10))
sns.move_legend(ax[0], 'upper right', fontsize=20)
sns.violinplot(data=df_train, x='Sex', y='Age', hue='Survived', density_norm='count', split=True, gap=.1, inner='quart', ax=ax[1])
ax[1].set_title('Age and Survived Distribution by Sex', fontsize=25, y=1.02)
ax[1].set_yticks(range(0, 110, 10))
sns.move_legend(ax[1], 'upper right', fontsize=20)
plt.show()
1
2
3
4
5
6
7
8
9
10
11
12
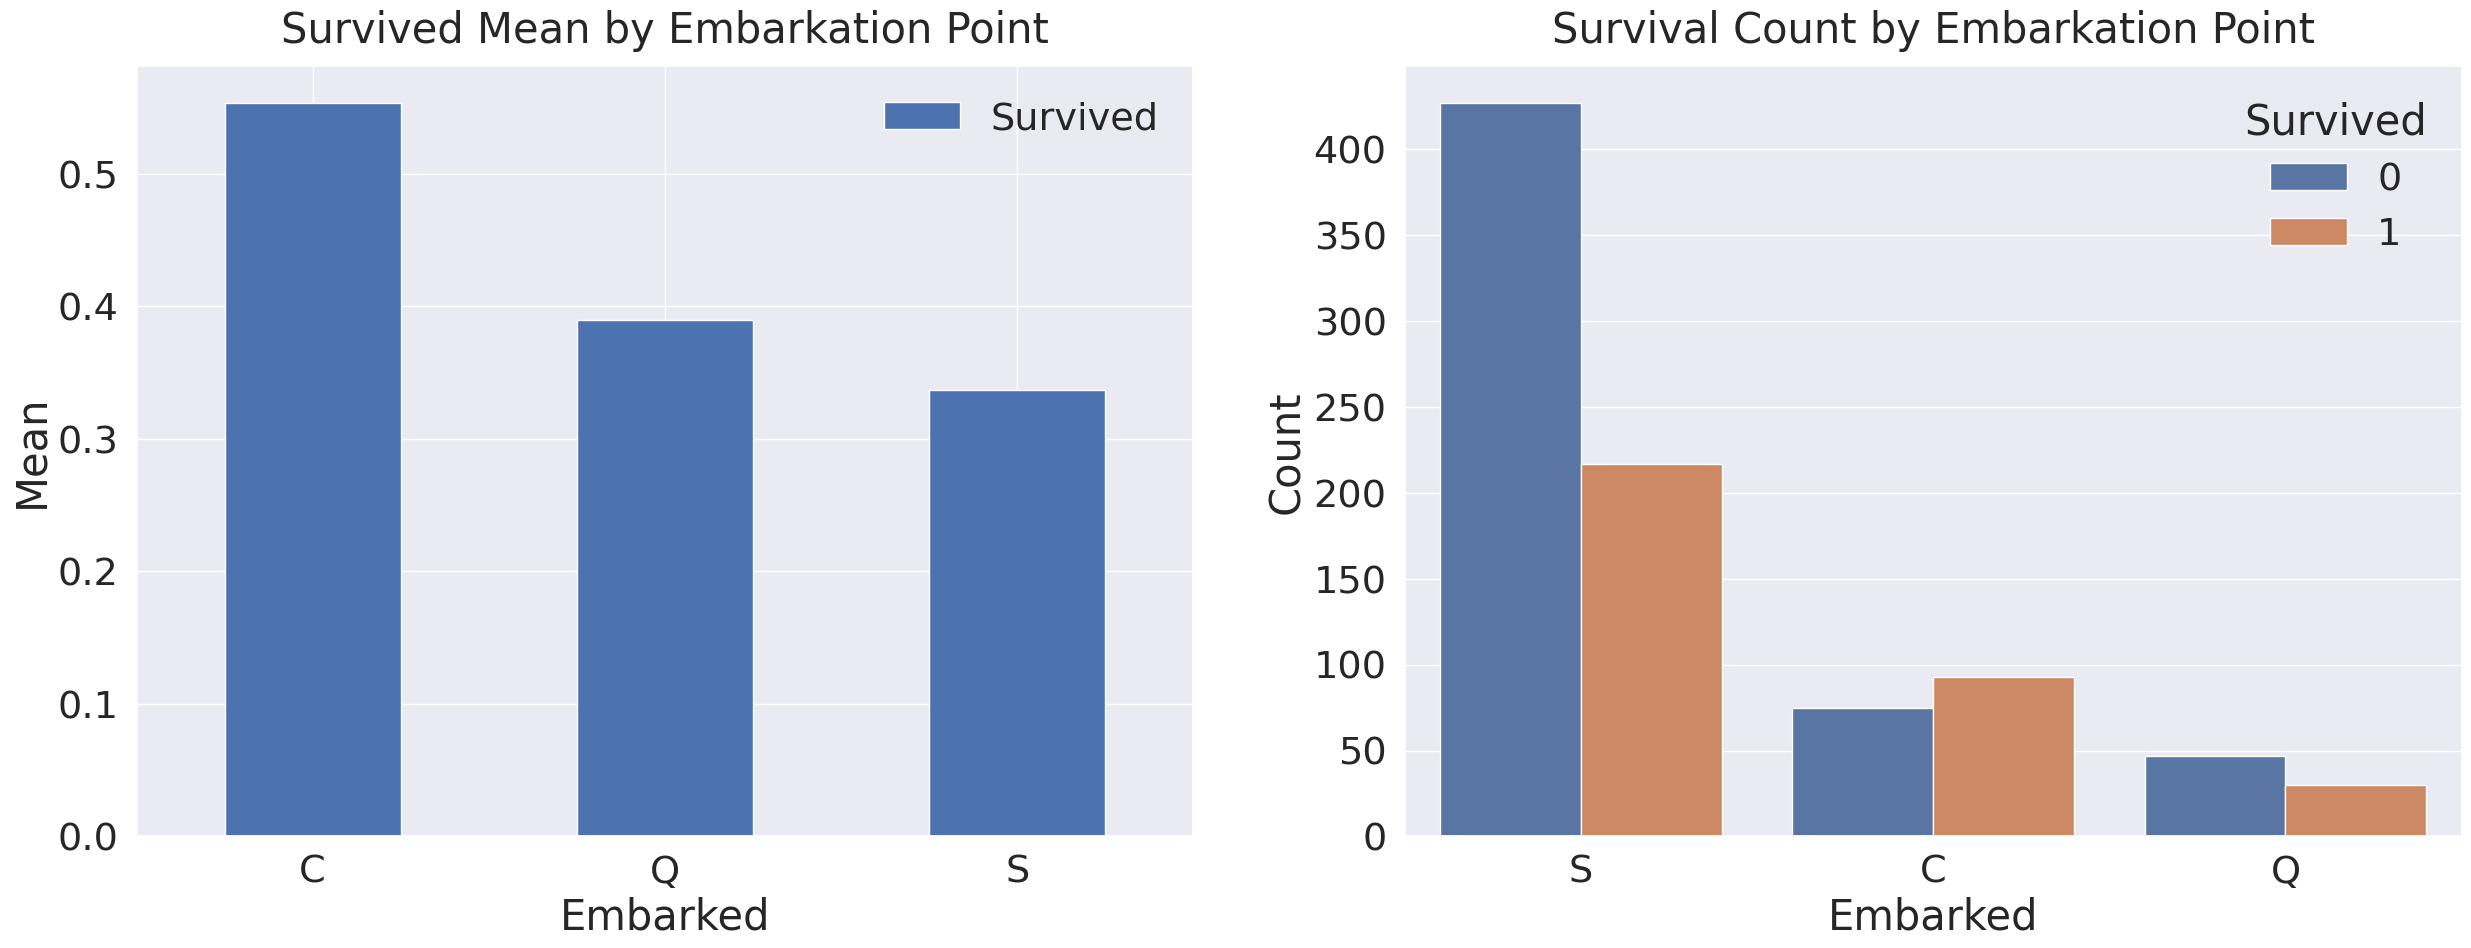
fig, ax = plt.subplots(1, 2, figsize=(30, 10))
df_train[['Embarked', 'Survived']].groupby(['Embarked']).mean().sort_values(by='Survived', ascending=False).plot.bar(ax=ax[0])
ax[0].set_title('Survived Mean by Embarkation Point', y=1.02)
ax[0].set_ylabel('Mean')
ax[0].set_xticklabels(ax[0].get_xticklabels(), rotation=0)
sns.countplot(data=df_train, x='Embarked', hue='Survived', ax=ax[1])
plt.xlabel('Embarked')
plt.ylabel('Count')
plt.title('Survival Count by Embarkation Point', y=1.02)
plt.show()
1
2
3
4
5
6
7
8
9
10
11
12
13
14
15
16
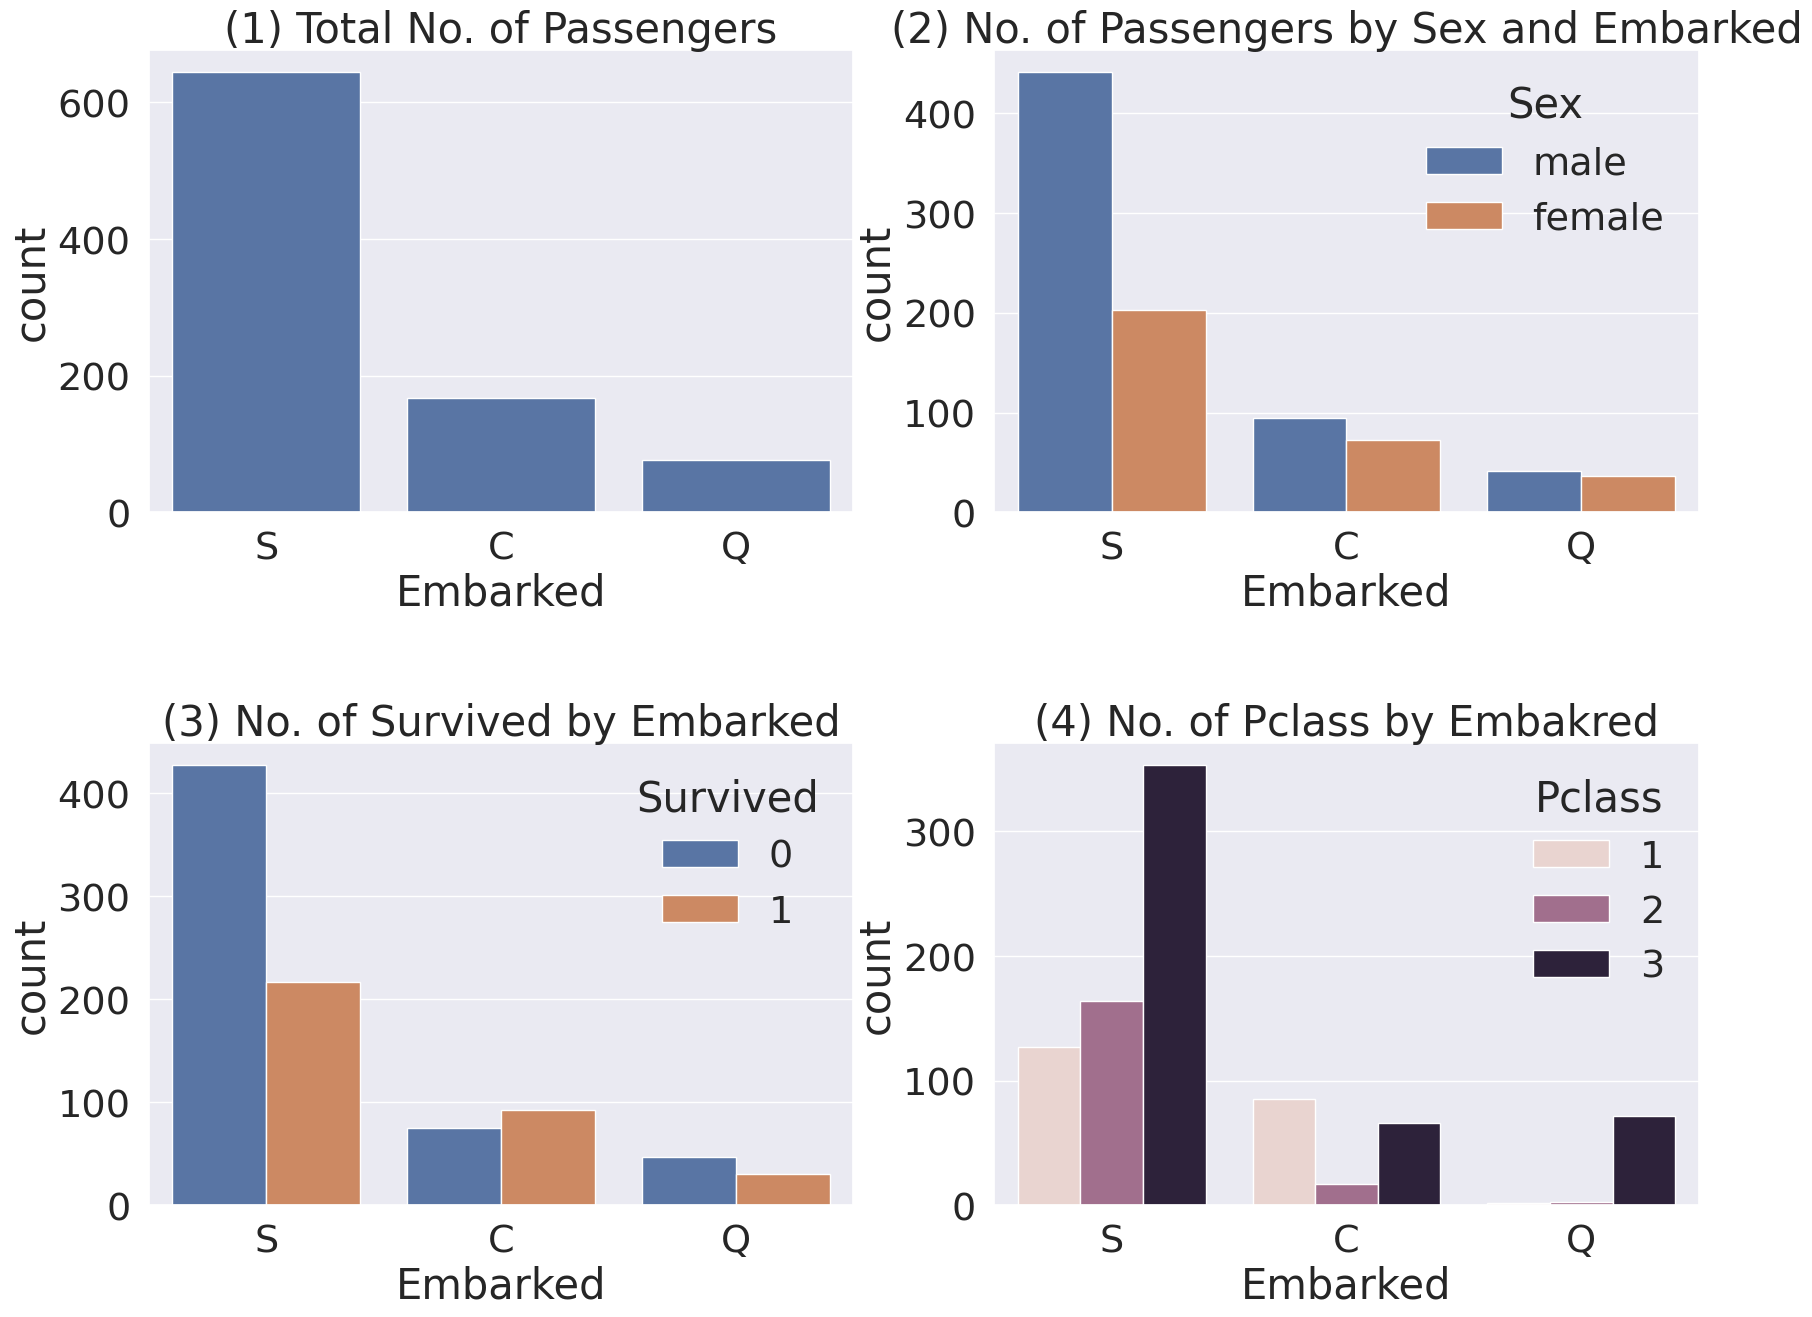
fig, ax = plt.subplots(2, 2, figsize=(20, 15))
sns.countplot(data=df_train, x='Embarked', ax=ax[0, 0])
ax[0, 0].set_title('(1) Total No. of Passengers')
sns.countplot(data=df_train, x='Embarked', hue='Sex', ax=ax[0, 1])
ax[0, 1].set_title('(2) No. of Passengers by Sex and Embarked')
sns.countplot(data=df_train, x='Embarked', hue='Survived', ax=ax[1, 0])
ax[1, 0].set_title('(3) No. of Survived by Embarked')
sns.countplot(data=df_train, x='Embarked', hue='Pclass', ax=ax[1, 1])
ax[1, 1].set_title('(4) No. of Pclass by Embakred')
plt.subplots_adjust(wspace=0.2, hspace=0.5)
plt.show()
1
2
3
4
5
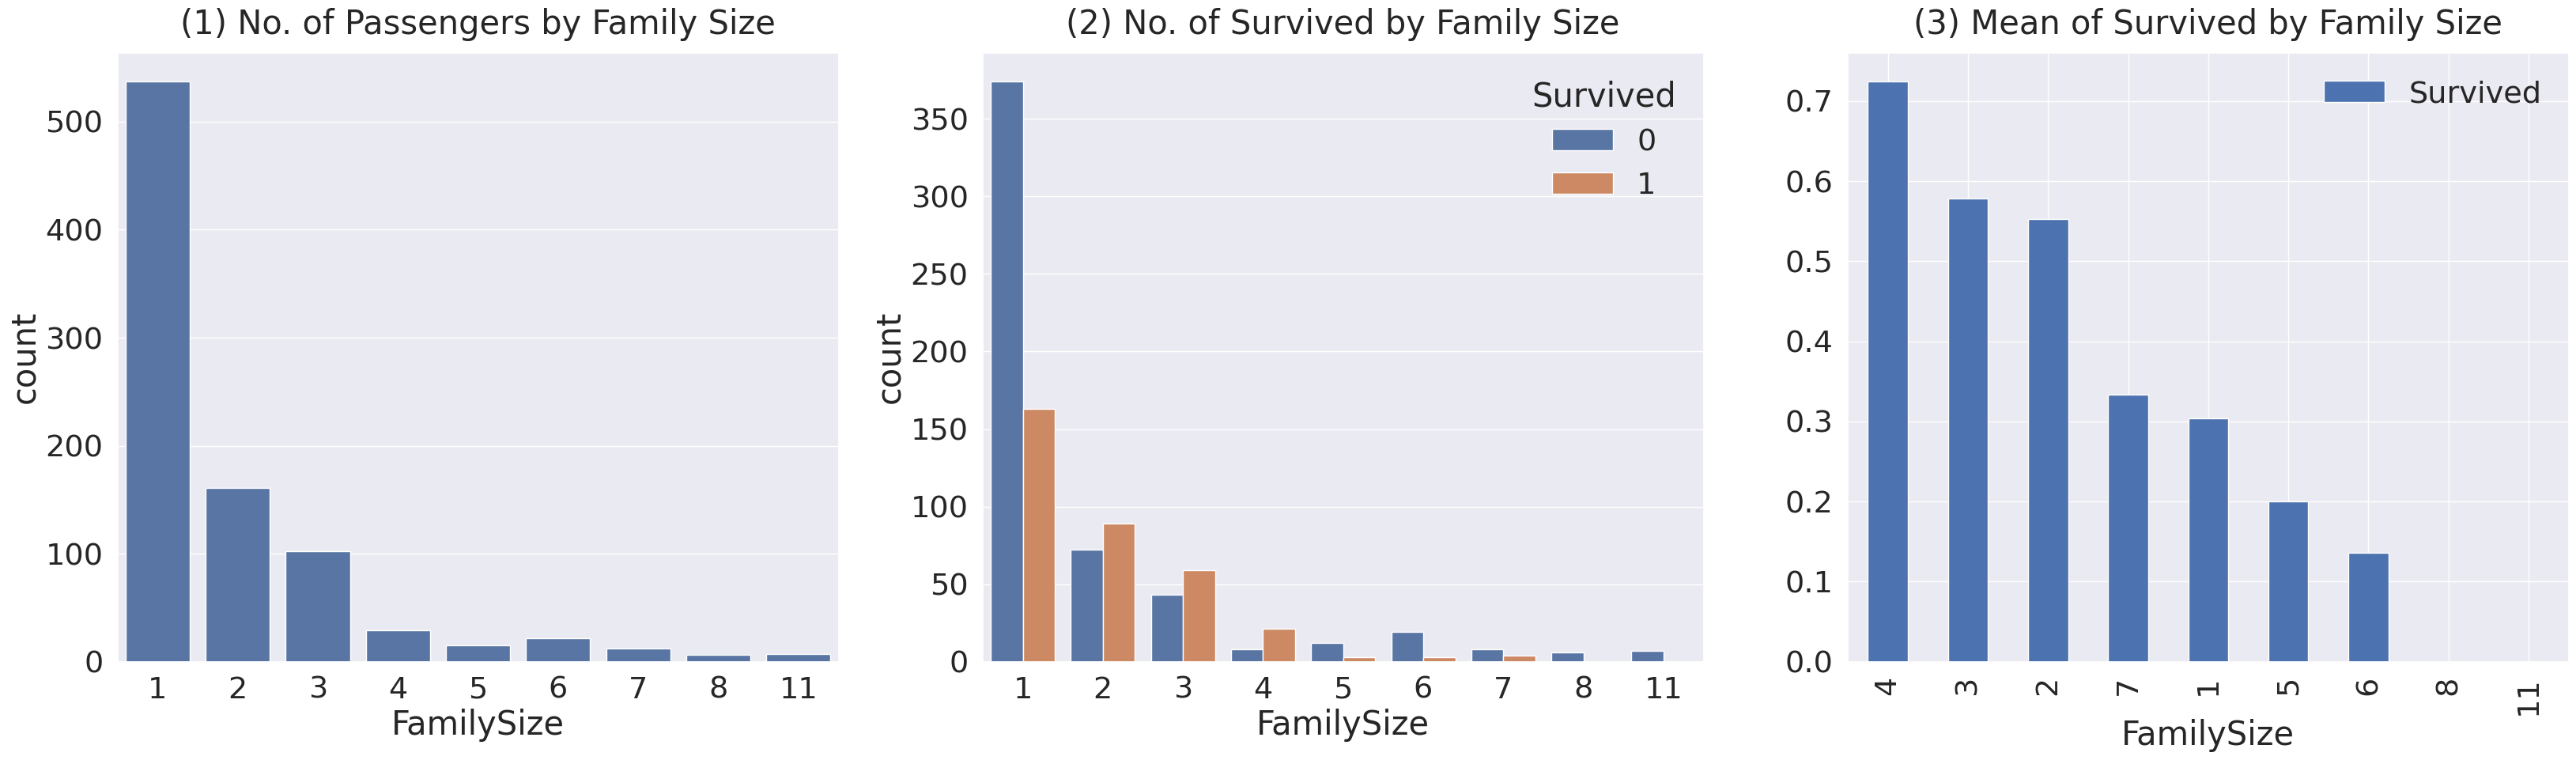
df_train['FamilySize'] = df_train['SibSp'] + df_train['Parch'] + 1
df_test['FamilySize'] = df_test['SibSp'] + df_train['Parch'] + 1
print('Maximum Size of Family: ', df_train['FamilySize'].max())
print('Minimum Size of Family: ', df_train['FamilySize'].min())
1
2
Maximum Size of Family:  11
Minimum Size of Family:  1
1
2
3
4
5
6
7
8
9
10
11
12
13
fig, ax = plt.subplots(1, 3, figsize=(40, 10))

sns.countplot(data=df_train, x='FamilySize', ax=ax[0])
ax[0].set_title('(1) No. of Passengers by Family Size', y=1.02)

sns.countplot(data=df_train, x='FamilySize', hue='Survived', ax=ax[1])
ax[1].set_title('(2) No. of Survived by Family Size', y=1.02)

df_train[['FamilySize', 'Survived']].groupby(['FamilySize']).mean().sort_values(by='Survived', ascending=False).plot.bar(ax=ax[2])
ax[2].set_title('(3) Mean of Survived by Family Size', y=1.02)

plt.subplots_adjust(wspace=0.2, hspace=0.5)
plt.show()
1
2
3
4
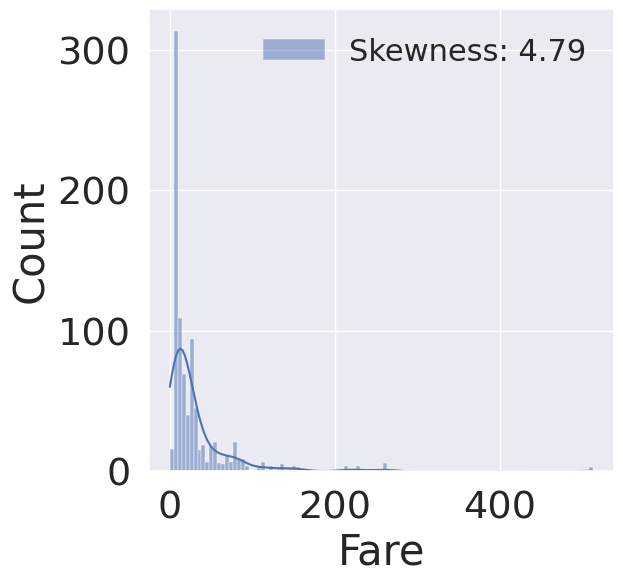
fig, ax = plt.subplots(1, 1, figsize=(6, 6))
fare_histplot = sns.histplot(df_train['Fare'], label='Skewness: {:.2f}'.format(df_train['Fare'].skew()), kde=True, ax=ax)
fare_histplot = fare_histplot.legend(loc='best', fontsize=22)
1
2
3
4
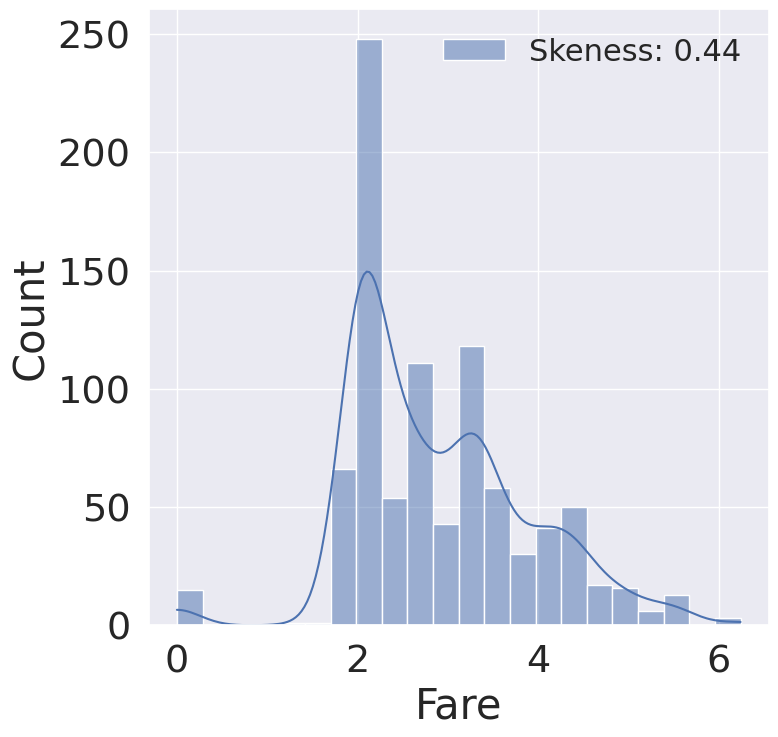
df_test.loc[df_test.Fare.isnull(), 'Fare'] = df_test['Fare'].mean()
df_train['Fare'] = df_train['Fare'].map(lambda x: np.log(x) if x > 0 else 0)
df_test['Fare'] = df_test['Fare'].map(lambda x: np.log(x) if x > 0 else 0)
1
2
3
4
fig, ax = plt.subplots(1, 1, figsize=(8, 8))

fare_loghist = sns.histplot(df_train['Fare'], label='Skeness: {:.2f}'.format(df_train['Fare'].skew()), kde=True, ax=ax)
fare_loghist = fare_loghist.legend(loc='best', fontsize=22)
1
df_train.head()
| PassengerId | Survived | Pclass | Name | Sex | Age | SibSp | Parch | Ticket | Fare | Cabin | Embarked | |
|---|---|---|---|---|---|---|---|---|---|---|---|---|
| 0 | 1 | 0 | 3 | Braund, Mr. Owen Harris | male | 22.0 | 1 | 0 | A/5 21171 | 7.2500 | NaN | S |
| 1 | 2 | 1 | 1 | Cumings, Mrs. John Bradley (Florence Briggs Th... | female | 38.0 | 1 | 0 | PC 17599 | 71.2833 | C85 | C |
| 2 | 3 | 1 | 3 | Heikkinen, Miss. Laina | female | 26.0 | 0 | 0 | STON/O2. 3101282 | 7.9250 | NaN | S |
| 3 | 4 | 1 | 1 | Futrelle, Mrs. Jacques Heath (Lily May Peel) | female | 35.0 | 1 | 0 | 113803 | 53.1000 | C123 | S |
| 4 | 5 | 0 | 3 | Allen, Mr. William Henry | male | 35.0 | 0 | 0 | 373450 | 8.0500 | NaN | S |
1
df_train['Ticket'].value_counts()
1
2
3
4
5
6
7
8
9
10
11
12
347082      7
CA. 2343    7
1601        7
3101295     6
CA 2144     6
           ..
9234        1
19988       1
2693        1
PC 17612    1
370376      1
Name: Ticket, Length: 681, dtype: int64
1
2
3
4
5
6
7
8
9
10
11
12
# 2번째

df_train = pd.read_csv('../data/titanic/train.csv')
df_test = pd.read_csv('../data/titanic/test.csv')

df_train['FamilySize'] = df_train['SibSp'] + df_train['Parch'] + 1
df_test['FamilySize'] = df_test['SibSp'] + df_test['Parch'] + 1

df_test.loc[df_test.Fare.isnull(), 'Fare'] = df_test['Fare'].mean()

df_train['Fare'] = df_train['Fare'].map(lambda x: np.log(x) if x > 0 else 0)
df_test['Fare'] = df_test['Fare'].map(lambda x: np.log(x) if x > 0 else 0)
1
2
df_train['Initial'] = df_train.Name.str.extract('([A-Za-z]+)\.')
df_test['Initial'] = df_test.Name.str.extract('([A-Za-z]+)\.')
1
pd.crosstab(df_train['Initial'], df_train['Sex']).T.style.background_gradient(cmap='summer_r')
| Initial | Capt | Col | Countess | Don | Dr | Jonkheer | Lady | Major | Master | Miss | Mlle | Mme | Mr | Mrs | Ms | Rev | Sir |
|---|---|---|---|---|---|---|---|---|---|---|---|---|---|---|---|---|---|
| Sex | |||||||||||||||||
| female | 0 | 0 | 1 | 0 | 1 | 0 | 1 | 0 | 0 | 182 | 2 | 1 | 0 | 125 | 1 | 0 | 0 |
| male | 1 | 2 | 0 | 1 | 6 | 1 | 0 | 2 | 40 | 0 | 0 | 0 | 517 | 0 | 0 | 6 | 1 |
1
2
3
4
df_train['Initial'].replace(['Mlle', 'Mme', 'Ms', 'Dr', 'Major', 'Lady', 'Countess', 'Jonkheer', 'Col', 'Rev', 'Capt', 'Sir', 'Don', 'Dona'],
                            ['Miss', 'Miss', 'Miss', 'Mr', 'Mr', 'Mrs', 'Mrs', 'Other', 'Other', 'Other', 'Mr', 'Mr', 'Mr', 'Mr'], inplace=True)
df_test['Initial'].replace(['Mlle', 'Mme', 'Ms', 'Dr', 'Major', 'Lady', 'Countess', 'Jonkheer', 'Col', 'Rev', 'Capt', 'Sir', 'Don', 'Dona'],
                            ['Miss', 'Miss', 'Miss', 'Mr', 'Mr', 'Mrs', 'Mrs', 'Other', 'Other', 'Other', 'Mr', 'Mr', 'Mr', 'Mr'], inplace=True)
1
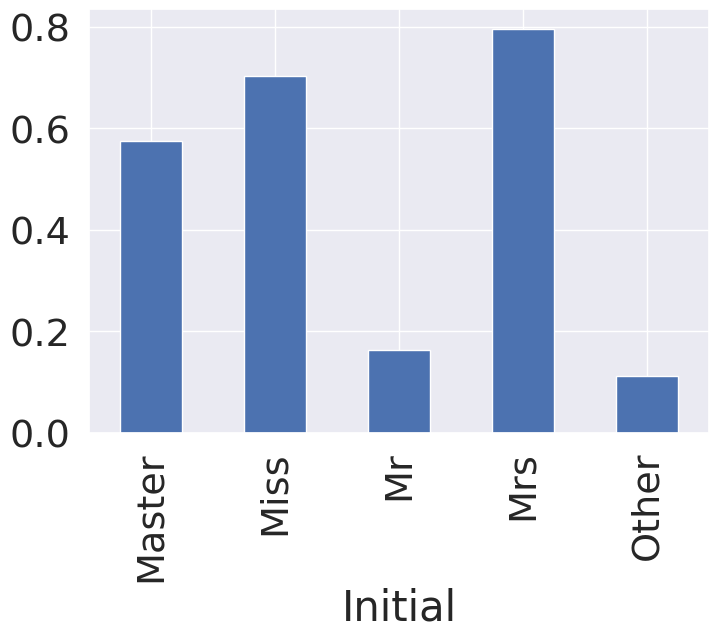
df_train.groupby('Initial')['Survived'].mean().plot.bar()
1
<AxesSubplot:xlabel='Initial'>
1
df_train.groupby('Initial').mean()
| PassengerId | Survived | Pclass | Age | SibSp | Parch | Fare | FamilySize | |
|---|---|---|---|---|---|---|---|---|
| Initial | ||||||||
| Master | 414.975000 | 0.575000 | 2.625000 | 4.574167 | 2.300000 | 1.375000 | 3.340710 | 4.675000 |
| Miss | 411.741935 | 0.704301 | 2.284946 | 21.860000 | 0.698925 | 0.537634 | 3.123713 | 2.236559 |
| Mr | 455.880907 | 0.162571 | 2.381853 | 32.739609 | 0.293006 | 0.151229 | 2.651507 | 1.444234 |
| Mrs | 456.393701 | 0.795276 | 1.984252 | 35.981818 | 0.692913 | 0.818898 | 3.443751 | 2.511811 |
| Other | 564.444444 | 0.111111 | 1.666667 | 45.888889 | 0.111111 | 0.111111 | 2.641605 | 1.222222 |
1
2
3
4
5
6
7
8
9
10
11
df_train.loc[(df_train.Age.isnull())&(df_train.Initial=='Master'), 'Age'] = 5
df_train.loc[(df_train.Age.isnull())&(df_train.Initial=='Miss'), 'Age'] = 22
df_train.loc[(df_train.Age.isnull())&(df_train.Initial=='Mr'), 'Age'] = 33
df_train.loc[(df_train.Age.isnull())&(df_train.Initial=='Mrs'), 'Age'] = 36
df_train.loc[(df_train.Age.isnull())&(df_train.Initial=='Other'), 'Age'] = 46

df_test.loc[(df_test.Age.isnull())&(df_test.Initial=='Master'), 'Age'] = 5
df_test.loc[(df_test.Age.isnull())&(df_test.Initial=='Miss'), 'Age'] = 22
df_test.loc[(df_test.Age.isnull())&(df_test.Initial=='Mr'), 'Age'] = 33
df_test.loc[(df_test.Age.isnull())&(df_test.Initial=='Mrs'), 'Age'] = 36
df_test.loc[(df_test.Age.isnull())&(df_test.Initial=='Other'), 'Age'] = 46
1
print('Embarked has ', sum(df_train['Embarked'].isnull()), ' Null values')
1
Embarked has  2  Null values
1
df_train['Embarked'].fillna('S', inplace=True)
1
2
3
4
5
6
7
8
9
10
11
12
13
14
15
16
17
18
19
df_train['Age_cat'] = 0
df_train.loc[df_train['Age'] < 10, 'Age_cat'] = 0
df_train.loc[(10 <= df_train['Age']) & (df_train['Age'] < 20), 'Age_cat'] = 1
df_train.loc[(20 <= df_train['Age']) & (df_train['Age'] < 30), 'Age_cat'] = 2
df_train.loc[(30 <= df_train['Age']) & (df_train['Age'] < 40), 'Age_cat'] = 3
df_train.loc[(40 <= df_train['Age']) & (df_train['Age'] < 50), 'Age_cat'] = 4
df_train.loc[(50 <= df_train['Age']) & (df_train['Age'] < 60), 'Age_cat'] = 5
df_train.loc[(60 <= df_train['Age']) & (df_train['Age'] < 70), 'Age_cat'] = 6
df_train.loc[70 <= df_train['Age'], 'Age_cat'] = 7

df_test['Age_cat'] = 0
df_test.loc[df_test['Age'] < 10, 'Age_cat'] = 0
df_test.loc[(10 <= df_test['Age']) & (df_test['Age'] < 20), 'Age_cat'] = 1
df_test.loc[(20 <= df_test['Age']) & (df_test['Age'] < 30), 'Age_cat'] = 2
df_test.loc[(30 <= df_test['Age']) & (df_test['Age'] < 40), 'Age_cat'] = 3
df_test.loc[(40 <= df_test['Age']) & (df_test['Age'] < 50), 'Age_cat'] = 4
df_test.loc[(50 <= df_test['Age']) & (df_test['Age'] < 60), 'Age_cat'] = 5
df_test.loc[(60 <= df_test['Age']) & (df_test['Age'] < 70), 'Age_cat'] = 6
df_test.loc[70 <= df_test['Age'], 'Age_cat'] = 7
1
2
3
4
5
6
7
8
9
10
11
12
13
14
15
16
17
18
19
def category_age(i):
    if i < 10:
        return 0
    elif i < 20:
        return 1
    elif i < 30:
        return 2
    elif i < 40:
        return 3
    elif i < 50:
        return 4
    elif i < 60:
        return 5
    elif i < 70:
        return 6
    else:
        return 7

df_train['Age_cat_2'] = df_train['Age'].apply(category_age)
1
print('Do Age_cat and Age_cat result same? ', (df_train['Age_cat'] == df_train['Age_cat_2']).all())
1
Do Age_cat and Age_cat result same?  True
1
2
df_train.drop(['Age', 'Age_cat_2'], axis=1, inplace=True)
df_test.drop(['Age'], axis=1, inplace=True)
1
2
df_train['Initial'] = df_train['Initial'].map({'Master': 0, 'Miss': 1, 'Mr': 2, 'Mrs': 3, 'Other': 4})
df_test['Initial'] = df_test['Initial'].map({'Master': 0, 'Miss': 1, 'Mr': 2, 'Mrs': 3, 'Other': 4})
1
df_train['Embarked'].unique()
1
array(['S', 'C', 'Q'], dtype=object)
1
df_train['Embarked'].value_counts()
1
2
3
4
S    646
C    168
Q     77
Name: Embarked, dtype: int64
1
2
df_train['Embarked'] = df_train['Embarked'].map({'C': 0, 'Q': 1, 'S': 2})
df_test['Embarked'] = df_test['Embarked'].map({'C': 0, 'Q': 1, 'S': 2})
1
df_train['Embarked'].isnull().any()
1
False
1
2
df_train['Sex'] = df_train['Sex'].map({'female': 0, 'male': 1})
df_test['Sex'] = df_test['Sex'].map({'female': 0, 'male': 1})
1
2
3
4
5
6
7
8
9
10
heatmap_data = df_train[['Survived', 'Pclass', 'Sex', 'Fare', 'Embarked', 'FamilySize', 'Initial', 'Age_cat']]

colormap = plt.cm.RdBu

plt.figure(figsize=(14, 12))
plt.title('Pearson Correlation Coefficient of Fetures', y=1.02, size=20)

sns.heatmap(heatmap_data.astype(float).corr(), vmax=1.0, cmap=colormap, annot=True, annot_kws={'size': 16}, linewidths=0.1, linecolor='white', square=True)

del heatmap_data
1
2
df_train = pd.get_dummies(df_train, prefix='Initial', columns=['Initial'])
df_test = pd.get_dummies(df_test, prefix='Initial', columns=['Initial'])
1
df_train.head()
| PassengerId | Survived | Pclass | Name | Sex | SibSp | Parch | Ticket | Fare | Cabin | Embarked | FamilySize | Age_cat | Initial_0 | Initial_1 | Initial_2 | Initial_3 | Initial_4 | |
|---|---|---|---|---|---|---|---|---|---|---|---|---|---|---|---|---|---|---|
| 0 | 1 | 0 | 3 | Braund, Mr. Owen Harris | 1 | 1 | 0 | A/5 21171 | 1.981001 | NaN | 2 | 2 | 2 | 0 | 0 | 1 | 0 | 0 |
| 1 | 2 | 1 | 1 | Cumings, Mrs. John Bradley (Florence Briggs Th... | 0 | 1 | 0 | PC 17599 | 4.266662 | C85 | 0 | 2 | 3 | 0 | 0 | 0 | 1 | 0 |
| 2 | 3 | 1 | 3 | Heikkinen, Miss. Laina | 0 | 0 | 0 | STON/O2. 3101282 | 2.070022 | NaN | 2 | 1 | 2 | 0 | 1 | 0 | 0 | 0 |
| 3 | 4 | 1 | 1 | Futrelle, Mrs. Jacques Heath (Lily May Peel) | 0 | 1 | 0 | 113803 | 3.972177 | C123 | 2 | 2 | 3 | 0 | 0 | 0 | 1 | 0 |
| 4 | 5 | 0 | 3 | Allen, Mr. William Henry | 1 | 0 | 0 | 373450 | 2.085672 | NaN | 2 | 1 | 3 | 0 | 0 | 1 | 0 | 0 |
1
df_test.head()
| PassengerId | Pclass | Name | Sex | SibSp | Parch | Ticket | Fare | Cabin | Embarked | FamilySize | Age_cat | Initial_0 | Initial_1 | Initial_2 | Initial_3 | Initial_4 | |
|---|---|---|---|---|---|---|---|---|---|---|---|---|---|---|---|---|---|
| 0 | 892 | 3 | Kelly, Mr. James | 1 | 0 | 0 | 330911 | 2.057860 | NaN | 1 | 1 | 3 | 0 | 0 | 1 | 0 | 0 |
| 1 | 893 | 3 | Wilkes, Mrs. James (Ellen Needs) | 0 | 1 | 0 | 363272 | 1.945910 | NaN | 2 | 2 | 4 | 0 | 0 | 0 | 1 | 0 |
| 2 | 894 | 2 | Myles, Mr. Thomas Francis | 1 | 0 | 0 | 240276 | 2.270836 | NaN | 1 | 1 | 6 | 0 | 0 | 1 | 0 | 0 |
| 3 | 895 | 3 | Wirz, Mr. Albert | 1 | 0 | 0 | 315154 | 2.159003 | NaN | 2 | 1 | 2 | 0 | 0 | 1 | 0 | 0 |
| 4 | 896 | 3 | Hirvonen, Mrs. Alexander (Helga E Lindqvist) | 0 | 1 | 1 | 3101298 | 2.508582 | NaN | 2 | 3 | 2 | 0 | 0 | 0 | 1 | 0 |
1
2
df_train = pd.get_dummies(df_train, prefix='Embarked', columns=['Embarked'])
df_test = pd.get_dummies(df_test, prefix='Embarked', columns=['Embarked'])
1
df_train.head()
| PassengerId | Survived | Pclass | Name | Sex | SibSp | Parch | Ticket | Fare | Cabin | FamilySize | Age_cat | Initial_0 | Initial_1 | Initial_2 | Initial_3 | Initial_4 | Embarked_0 | Embarked_1 | Embarked_2 | |
|---|---|---|---|---|---|---|---|---|---|---|---|---|---|---|---|---|---|---|---|---|
| 0 | 1 | 0 | 3 | Braund, Mr. Owen Harris | 1 | 1 | 0 | A/5 21171 | 1.981001 | NaN | 2 | 2 | 0 | 0 | 1 | 0 | 0 | 0 | 0 | 1 |
| 1 | 2 | 1 | 1 | Cumings, Mrs. John Bradley (Florence Briggs Th... | 0 | 1 | 0 | PC 17599 | 4.266662 | C85 | 2 | 3 | 0 | 0 | 0 | 1 | 0 | 1 | 0 | 0 |
| 2 | 3 | 1 | 3 | Heikkinen, Miss. Laina | 0 | 0 | 0 | STON/O2. 3101282 | 2.070022 | NaN | 1 | 2 | 0 | 1 | 0 | 0 | 0 | 0 | 0 | 1 |
| 3 | 4 | 1 | 1 | Futrelle, Mrs. Jacques Heath (Lily May Peel) | 0 | 1 | 0 | 113803 | 3.972177 | C123 | 2 | 3 | 0 | 0 | 0 | 1 | 0 | 0 | 0 | 1 |
| 4 | 5 | 0 | 3 | Allen, Mr. William Henry | 1 | 0 | 0 | 373450 | 2.085672 | NaN | 1 | 3 | 0 | 0 | 1 | 0 | 0 | 0 | 0 | 1 |
1
df_test.head()
| PassengerId | Pclass | Name | Sex | SibSp | Parch | Ticket | Fare | Cabin | FamilySize | Age_cat | Initial_0 | Initial_1 | Initial_2 | Initial_3 | Initial_4 | Embarked_0 | Embarked_1 | Embarked_2 | |
|---|---|---|---|---|---|---|---|---|---|---|---|---|---|---|---|---|---|---|---|
| 0 | 892 | 3 | Kelly, Mr. James | 1 | 0 | 0 | 330911 | 2.057860 | NaN | 1 | 3 | 0 | 0 | 1 | 0 | 0 | 0 | 1 | 0 |
| 1 | 893 | 3 | Wilkes, Mrs. James (Ellen Needs) | 0 | 1 | 0 | 363272 | 1.945910 | NaN | 2 | 4 | 0 | 0 | 0 | 1 | 0 | 0 | 0 | 1 |
| 2 | 894 | 2 | Myles, Mr. Thomas Francis | 1 | 0 | 0 | 240276 | 2.270836 | NaN | 1 | 6 | 0 | 0 | 1 | 0 | 0 | 0 | 1 | 0 |
| 3 | 895 | 3 | Wirz, Mr. Albert | 1 | 0 | 0 | 315154 | 2.159003 | NaN | 1 | 2 | 0 | 0 | 1 | 0 | 0 | 0 | 0 | 1 |
| 4 | 896 | 3 | Hirvonen, Mrs. Alexander (Helga E Lindqvist) | 0 | 1 | 1 | 3101298 | 2.508582 | NaN | 3 | 2 | 0 | 0 | 0 | 1 | 0 | 0 | 0 | 1 |
1
2
df_train.drop(['PassengerId', 'Name', 'SibSp', 'Parch', 'Ticket', 'Cabin'], axis=1, inplace=True)
df_test.drop(['PassengerId', 'Name', 'SibSp', 'Parch', 'Ticket', 'Cabin'], axis=1, inplace=True)
1
df_train.head()
| Survived | Pclass | Sex | Fare | FamilySize | Age_cat | Initial_0 | Initial_1 | Initial_2 | Initial_3 | Initial_4 | Embarked_0 | Embarked_1 | Embarked_2 | |
|---|---|---|---|---|---|---|---|---|---|---|---|---|---|---|
| 0 | 0 | 3 | 1 | 1.981001 | 2 | 2 | 0 | 0 | 1 | 0 | 0 | 0 | 0 | 1 |
| 1 | 1 | 1 | 0 | 4.266662 | 2 | 3 | 0 | 0 | 0 | 1 | 0 | 1 | 0 | 0 |
| 2 | 1 | 3 | 0 | 2.070022 | 1 | 2 | 0 | 1 | 0 | 0 | 0 | 0 | 0 | 1 |
| 3 | 1 | 1 | 0 | 3.972177 | 2 | 3 | 0 | 0 | 0 | 1 | 0 | 0 | 0 | 1 |
| 4 | 0 | 3 | 1 | 2.085672 | 1 | 3 | 0 | 0 | 1 | 0 | 0 | 0 | 0 | 1 |
1
df_test.head()
| Pclass | Sex | Fare | FamilySize | Age_cat | Initial_0 | Initial_1 | Initial_2 | Initial_3 | Initial_4 | Embarked_0 | Embarked_1 | Embarked_2 | |
|---|---|---|---|---|---|---|---|---|---|---|---|---|---|
| 0 | 3 | 1 | 2.057860 | 1 | 3 | 0 | 0 | 1 | 0 | 0 | 0 | 1 | 0 |
| 1 | 3 | 0 | 1.945910 | 2 | 4 | 0 | 0 | 0 | 1 | 0 | 0 | 0 | 1 |
| 2 | 2 | 1 | 2.270836 | 1 | 6 | 0 | 0 | 1 | 0 | 0 | 0 | 1 | 0 |
| 3 | 3 | 1 | 2.159003 | 1 | 2 | 0 | 0 | 1 | 0 | 0 | 0 | 0 | 1 |
| 4 | 3 | 0 | 2.508582 | 3 | 2 | 0 | 0 | 0 | 1 | 0 | 0 | 0 | 1 |
1
2
3
from sklearn.ensemble import RandomForestClassifier
from sklearn import metrics
from sklearn.model_selection import train_test_split
1
2
3
X_train = df_train.drop('Survived', axis=1).values
target_label = df_train['Survived'].values
X_test = df_test.values
1
X_tr, X_vld, y_tr, y_vld = train_test_split(X_train, target_label, test_size=0.3, random_state=2018)
1
X_tr
1
2
3
4
5
6
7
8
9
10
11
12
13
array([[1.        , 1.        , 4.11373861, ..., 0.        , 0.        ,
        1.        ],
       [3.        , 1.        , 2.05412373, ..., 0.        , 0.        ,
        1.        ],
       [1.        , 1.        , 5.354225  , ..., 1.        , 0.        ,
        0.        ],
       ...,
       [2.        , 1.        , 2.35137526, ..., 0.        , 0.        ,
        1.        ],
       [3.        , 1.        , 2.08567209, ..., 0.        , 0.        ,
        1.        ],
       [3.        , 1.        , 1.98100147, ..., 0.        , 0.        ,
        1.        ]])
1
X_tr.shape[0]
1
623
1
X_vld
1
2
3
4
5
6
7
8
9
10
11
12
13
array([[1.        , 1.        , 5.57215403, ..., 0.        , 0.        ,
        1.        ],
       [3.        , 1.        , 2.08567209, ..., 0.        , 0.        ,
        1.        ],
       [1.        , 1.        , 3.41772668, ..., 0.        , 0.        ,
        1.        ],
       ...,
       [1.        , 1.        , 3.25809654, ..., 0.        , 0.        ,
        1.        ],
       [2.        , 1.        , 2.35137526, ..., 0.        , 0.        ,
        1.        ],
       [2.        , 0.        , 3.66356165, ..., 0.        , 0.        ,
        1.        ]])
1
X_vld.shape[0]
1
268
1
y_tr
1
2
3
4
5
6
7
8
9
10
11
12
13
14
15
16
17
18
19
20
21
22
23
24
25
26
27
28
29
array([0, 0, 0, 1, 0, 1, 0, 0, 0, 0, 0, 0, 0, 0, 1, 0, 0, 0, 1, 1, 1, 1,
       1, 0, 1, 0, 0, 0, 1, 1, 0, 0, 0, 1, 0, 0, 0, 1, 0, 0, 0, 0, 1, 0,
       0, 0, 1, 0, 0, 1, 0, 1, 0, 0, 1, 0, 1, 0, 1, 0, 1, 0, 1, 0, 0, 1,
       0, 1, 0, 1, 1, 1, 0, 0, 0, 0, 1, 0, 0, 0, 0, 0, 0, 0, 1, 0, 1, 0,
       1, 0, 0, 1, 0, 1, 0, 0, 1, 1, 0, 0, 1, 0, 0, 1, 0, 0, 0, 1, 0, 1,
       0, 0, 1, 0, 0, 1, 1, 0, 0, 1, 1, 0, 1, 0, 0, 1, 0, 1, 0, 1, 0, 1,
       1, 0, 1, 1, 1, 0, 0, 0, 1, 1, 1, 0, 0, 0, 0, 0, 1, 1, 0, 0, 0, 1,
       1, 0, 1, 1, 1, 0, 0, 1, 1, 1, 0, 0, 0, 1, 0, 1, 1, 0, 0, 0, 0, 0,
       0, 0, 1, 1, 0, 1, 1, 1, 0, 1, 0, 0, 1, 0, 0, 1, 1, 1, 0, 0, 1, 1,
       0, 1, 1, 0, 0, 1, 1, 0, 0, 0, 0, 0, 0, 0, 0, 0, 1, 0, 0, 1, 0, 1,
       0, 0, 1, 0, 1, 0, 1, 0, 0, 1, 1, 1, 0, 0, 0, 1, 1, 1, 0, 1, 0, 1,
       1, 0, 0, 1, 1, 0, 0, 1, 1, 1, 1, 1, 0, 1, 0, 0, 1, 1, 1, 0, 0, 0,
       0, 1, 0, 0, 1, 0, 1, 1, 1, 0, 0, 1, 0, 0, 0, 0, 0, 0, 1, 0, 1, 1,
       0, 0, 0, 0, 1, 1, 0, 1, 0, 0, 0, 1, 0, 1, 1, 0, 0, 0, 0, 0, 1, 0,
       1, 0, 1, 1, 0, 0, 0, 0, 0, 0, 0, 0, 0, 1, 0, 1, 0, 1, 0, 0, 0, 1,
       0, 0, 0, 1, 1, 1, 0, 0, 1, 0, 0, 1, 0, 0, 0, 0, 0, 0, 0, 1, 0, 1,
       0, 0, 1, 0, 0, 0, 1, 1, 0, 0, 0, 0, 1, 0, 0, 1, 1, 0, 1, 0, 1, 1,
       1, 0, 0, 1, 1, 1, 0, 1, 1, 0, 0, 0, 1, 0, 1, 0, 1, 0, 0, 0, 1, 0,
       0, 1, 1, 0, 1, 0, 1, 0, 0, 0, 0, 0, 0, 0, 0, 1, 0, 0, 0, 0, 1, 1,
       0, 1, 1, 0, 0, 0, 0, 0, 0, 0, 1, 1, 1, 0, 0, 1, 1, 0, 0, 1, 0, 0,
       0, 0, 0, 0, 0, 1, 0, 1, 0, 1, 0, 1, 1, 1, 1, 1, 0, 1, 1, 0, 1, 0,
       0, 0, 0, 0, 1, 1, 0, 1, 0, 0, 0, 1, 1, 0, 1, 1, 0, 0, 1, 1, 0, 0,
       1, 0, 1, 1, 0, 1, 0, 0, 0, 0, 1, 0, 1, 0, 1, 1, 0, 0, 0, 0, 0, 1,
       0, 0, 0, 0, 1, 1, 0, 1, 1, 0, 0, 1, 1, 1, 1, 0, 0, 0, 0, 0, 1, 0,
       0, 0, 0, 0, 0, 0, 0, 0, 1, 0, 0, 0, 1, 1, 1, 0, 0, 1, 0, 0, 0, 0,
       1, 1, 0, 1, 0, 1, 1, 0, 1, 0, 1, 1, 0, 0, 0, 1, 1, 0, 0, 0, 1, 0,
       0, 0, 0, 1, 1, 1, 0, 0, 0, 1, 1, 0, 1, 0, 1, 0, 0, 0, 0, 0, 0, 0,
       0, 1, 0, 0, 0, 0, 1, 0, 0, 0, 1, 1, 0, 0, 0, 0, 1, 0, 1, 0, 0, 0,
       1, 0, 1, 1, 1, 0, 0], dtype=int64)
1
y_tr.shape[0]
1
623
1
y_vld
1
2
3
4
5
6
7
8
9
10
11
12
13
array([0, 1, 1, 0, 0, 0, 0, 0, 0, 1, 0, 1, 1, 0, 0, 0, 0, 1, 1, 0, 0, 0,
       0, 0, 1, 0, 1, 0, 0, 0, 0, 0, 0, 1, 1, 1, 0, 0, 0, 0, 0, 0, 0, 1,
       0, 0, 1, 1, 0, 0, 1, 0, 1, 0, 1, 1, 0, 1, 1, 1, 0, 1, 0, 0, 1, 1,
       0, 0, 0, 0, 1, 0, 1, 0, 0, 0, 0, 1, 1, 0, 0, 0, 0, 1, 0, 1, 1, 0,
       0, 0, 1, 0, 0, 0, 0, 0, 0, 1, 0, 0, 1, 0, 0, 1, 0, 0, 1, 1, 1, 1,
       1, 1, 0, 0, 1, 1, 0, 0, 0, 0, 1, 0, 0, 0, 0, 0, 0, 1, 0, 0, 0, 0,
       0, 0, 0, 0, 1, 1, 1, 1, 1, 1, 0, 1, 0, 1, 0, 0, 0, 1, 1, 0, 0, 1,
       0, 1, 0, 0, 0, 0, 0, 0, 0, 0, 0, 0, 0, 0, 0, 0, 0, 1, 0, 1, 0, 1,
       1, 1, 1, 0, 0, 0, 0, 0, 1, 1, 1, 0, 0, 0, 0, 1, 0, 1, 1, 0, 0, 0,
       1, 1, 0, 1, 0, 1, 0, 0, 0, 0, 0, 1, 0, 1, 0, 0, 1, 1, 1, 0, 0, 1,
       0, 0, 0, 1, 1, 0, 0, 0, 0, 0, 0, 0, 1, 0, 0, 0, 0, 0, 1, 0, 1, 0,
       1, 0, 0, 0, 0, 1, 0, 0, 0, 0, 0, 0, 0, 1, 0, 1, 1, 1, 1, 0, 1, 1,
       1, 0, 0, 1], dtype=int64)
1
y_vld.shape[0]
1
268
1
2
3
model = RandomForestClassifier()
model.fit(X_tr, y_tr)
prediction = model.predict(X_vld)
1
print(prediction)
1
2
3
4
5
6
7
8
[0 1 0 0 1 0 0 0 0 0 0 1 1 0 0 1 0 1 1 0 0 0 0 0 0 0 0 0 0 0 0 0 0 1 1 0 0
 0 0 0 0 0 0 1 0 1 1 1 0 0 1 0 1 1 1 1 0 1 0 1 0 1 0 0 1 0 0 0 0 0 1 1 1 0
 0 0 0 0 0 0 0 0 1 1 0 1 1 1 0 0 1 0 1 0 0 0 0 0 0 0 0 1 0 1 0 0 1 1 0 1 1
 1 0 0 0 1 1 0 0 0 0 0 0 0 0 1 0 0 0 1 1 0 0 0 0 0 1 0 1 1 0 1 0 1 0 1 0 0
 0 0 0 0 0 0 0 1 0 0 0 1 0 0 0 1 0 0 1 0 0 0 0 1 0 1 0 1 1 1 1 0 0 0 0 0 1
 1 1 0 0 0 0 1 0 0 1 0 0 0 1 1 0 1 0 1 0 0 0 0 0 1 0 1 0 0 0 1 0 0 0 1 1 0
 0 0 1 0 0 0 0 0 0 0 0 0 0 0 0 0 1 1 1 0 1 0 0 1 0 1 1 0 0 0 0 0 0 1 0 1 1
 0 1 0 1 1 0 0 0 1]
1
print('Survived Predection with {:.2f}% accuracy out of total passengers {}'.format(100 * metrics.accuracy_score(y_vld, prediction), y_vld.shape[0]))
1
2
3
4
5
6
7
8
9
10
11
12
13
14
15
16
17
18
19
20
21
22
23
24
25
26
27
28
29
30
31
32
33
34
35
36
37
38
39
40
41
42
43
44
45
46
47
48
49
50
51
52
53
54
55
56
57
58
59
60
61
62
63
64
---------------------------------------------------------------------------

ValueError                                Traceback (most recent call last)

Cell In[97], line 1
----> 1 print('Survived Predection with {:.2f}% accuracy out of total passengers {}'.format(100 * metrics.accuracy_score(prediction, y_vld), y_vld.shape[0]))


File /lib/python3.11/site-packages/sklearn/utils/_param_validation.py:211, in validate_params.<locals>.decorator.<locals>.wrapper(*args, **kwargs)
    205 try:
    206     with config_context(
    207         skip_parameter_validation=(
    208             prefer_skip_nested_validation or global_skip_validation
    209         )
    210     ):
--> 211         return func(*args, **kwargs)
    212 except InvalidParameterError as e:
    213     # When the function is just a wrapper around an estimator, we allow
    214     # the function to delegate validation to the estimator, but we replace
    215     # the name of the estimator by the name of the function in the error
    216     # message to avoid confusion.
    217     msg = re.sub(
    218         r"parameter of \w+ must be",
    219         f"parameter of {func.__qualname__} must be",
    220         str(e),
    221     )


File /lib/python3.11/site-packages/sklearn/metrics/_classification.py:220, in accuracy_score(y_true, y_pred, normalize, sample_weight)
    154 """Accuracy classification score.
    155
    156 In multilabel classification, this function computes subset accuracy:
   (...)
    216 0.5
    217 """
    219 # Compute accuracy for each possible representation
--> 220 y_type, y_true, y_pred = _check_targets(y_true, y_pred)
    221 check_consistent_length(y_true, y_pred, sample_weight)
    222 if y_type.startswith("multilabel"):


File /lib/python3.11/site-packages/sklearn/metrics/_classification.py:84, in _check_targets(y_true, y_pred)
     57 def _check_targets(y_true, y_pred):
     58     """Check that y_true and y_pred belong to the same classification task.
     59
     60     This converts multiclass or binary types to a common shape, and raises a
   (...)
     82     y_pred : array or indicator matrix
     83     """
---> 84     check_consistent_length(y_true, y_pred)
     85     type_true = type_of_target(y_true, input_name="y_true")
     86     type_pred = type_of_target(y_pred, input_name="y_pred")


File /lib/python3.11/site-packages/sklearn/utils/validation.py:407, in check_consistent_length(*arrays)
    405 uniques = np.unique(lengths)
    406 if len(uniques) > 1:
--> 407     raise ValueError(
    408         "Found input variables with inconsistent numbers of samples: %r"
    409         % [int(l) for l in lengths]
    410     )


ValueError: Found input variables with inconsistent numbers of samples: [418, 268]
1
print(model.feature_importances_)
1
2
3
[0.09869027 0.11627062 0.33726262 0.09358139 0.11944675 0.01194506
 0.03424261 0.11596645 0.02474876 0.00479071 0.01296574 0.0122562
 0.01783281]
1
print(model.decision_path(X_vld))
1
2
3
4
5
6
7
8
9
10
11
12
13
(<268x26804 sparse matrix of type '<class 'numpy.intc'>'
	with 262443 stored elements in Compressed Sparse Row format>, array([    0,   255,   516,   773,  1038,  1287,  1530,  1797,  2052,
        2321,  2582,  2843,  3126,  3389,  3664,  3925,  4228,  4467,
        4722,  4997,  5270,  5523,  5778,  6031,  6312,  6579,  6852,
        7125,  7398,  7627,  7892,  8165,  8446,  8693,  8972,  9261,
        9528,  9825, 10094, 10359, 10600, 10875, 11162, 11433, 11688,
       11967, 12212, 12481, 12760, 13025, 13304, 13567, 13828, 14067,
       14318, 14595, 14880, 15163, 15466, 15757, 16016, 16315, 16582,
       16855, 17130, 17387, 17654, 17931, 18228, 18477, 18730, 18989,
       19274, 19539, 19794, 20053, 20326, 20603, 20886, 21149, 21400,
       21649, 21926, 22203, 22442, 22701, 22980, 23251, 23544, 23861,
       24120, 24385, 24654, 24913, 25178, 25451, 25700, 25957, 26242,
       26533, 26804]))
1
print(model.predict_proba(X_vld)[:10])
1
2
3
4
5
6
7
8
9
10
[[0.76       0.24      ]
 [0.38471429 0.61528571]
 [0.702      0.298     ]
 [0.99       0.01      ]
 [0.01       0.99      ]
 [1.         0.        ]
 [0.94416667 0.05583333]
 [0.98       0.02      ]
 [1.         0.        ]
 [0.74880952 0.25119048]]
1
print(model.get_params())
1
{'bootstrap': True, 'ccp_alpha': 0.0, 'class_weight': None, 'criterion': 'gini', 'max_depth': None, 'max_features': 'sqrt', 'max_leaf_nodes': None, 'max_samples': None, 'min_impurity_decrease': 0.0, 'min_samples_leaf': 1, 'min_samples_split': 2, 'min_weight_fraction_leaf': 0.0, 'n_estimators': 100, 'n_jobs': None, 'oob_score': False, 'random_state': None, 'verbose': 0, 'warm_start': False}
1
2
3
4
5
from pandas import Series

feature_importance = model.feature_importances_
Series_feat_imp = Series(feature_importance, index=df_test.columns)
print(Series_feat_imp)
1
2
3
4
5
6
7
8
9
10
11
12
13
14
Pclass        0.098690
Sex           0.116271
Fare          0.337263
FamilySize    0.093581
Age_cat       0.119447
Initial_0     0.011945
Initial_1     0.034243
Initial_2     0.115966
Initial_3     0.024749
Initial_4     0.004791
Embarked_0    0.012966
Embarked_1    0.012256
Embarked_2    0.017833
dtype: float64
1
2
3
4
5
6
7
8
num_features = len(Series_feat_imp)
random_colors = np.random.rand(num_features, 3)

plt.figure(figsize=(8, 8))
Series_feat_imp.sort_values(ascending=True).plot.barh(color=random_colors)
plt.xlabel('Feature Importance')
plt.ylabel('Feature')
plt.show()
1
2
cm = metrics.confusion_matrix(y_vld, prediction)
print('Confusion Matrix\n', cm)
1
2
3
Confusion Matrix
 [[152  20]
 [ 27  69]]
1
2
cr = metrics.classification_report(y_vld, prediction)
print('Classification Report\n', cr)
1
2
3
4
5
6
7
8
9
Classification Report
               precision    recall  f1-score   support

           0       0.85      0.88      0.87       172
           1       0.78      0.72      0.75        96

    accuracy                           0.82       268
   macro avg       0.81      0.80      0.81       268
weighted avg       0.82      0.82      0.82       268
1
submission = pd.read_csv('../data/titanic/gender_submission.csv')
1
submission.head()
| PassengerId | Survived | |
|---|---|---|
| 0 | 892 | 0 |
| 1 | 893 | 1 |
| 2 | 894 | 0 |
| 3 | 895 | 0 |
| 4 | 896 | 1 |
1
2
prediction = model.predict(X_test)
submission['Survived'] = prediction
1
print(submission)
1
2
3
4
5
6
7
8
9
10
11
12
13
14
     PassengerId  Survived
0            892         0
1            893         0
2            894         0
3            895         0
4            896         0
..           ...       ...
413         1305         0
414         1306         1
415         1307         0
416         1308         0
417         1309         1

[418 rows x 2 columns]
1
submission.to_csv('../data/titanic/my_first_submission.csv', index=False)
1
2
3
submission_true = pd.read_csv('../data/titanic/gender_submission.csv')
submission_true = np.array(submission_true['Survived'])
print(submission_true)
1
2
3
4
5
6
7
8
9
10
11
12
[0 1 0 0 1 0 1 0 1 0 0 0 1 0 1 1 0 0 1 1 0 0 1 0 1 0 1 0 0 0 0 0 1 1 0 0 1
 1 0 0 0 0 0 1 1 0 0 0 1 1 0 0 1 1 0 0 0 0 0 1 0 0 0 1 0 1 1 0 0 1 1 0 1 0
 1 0 0 1 0 1 0 0 0 0 0 0 1 1 1 0 1 0 1 0 0 0 1 0 1 0 1 0 0 0 1 0 0 0 0 0 0
 1 1 1 1 0 0 1 0 1 1 0 1 0 0 1 0 1 0 0 0 0 1 0 0 0 0 0 1 0 1 1 0 0 0 0 0 0
 0 0 1 0 0 1 0 0 1 1 0 1 1 0 1 0 0 1 0 0 1 1 0 0 0 0 0 1 1 0 1 1 0 0 1 0 1
 0 1 0 1 0 0 0 0 0 0 0 0 1 0 1 1 0 0 1 0 0 1 0 1 0 0 0 0 1 1 0 1 0 1 0 1 0
 1 0 1 1 0 1 0 0 0 1 0 0 0 0 0 0 1 1 1 1 0 0 0 0 1 0 1 1 1 0 0 0 0 0 0 0 1
 0 0 0 1 1 0 0 0 0 1 0 0 0 1 1 0 1 0 0 0 0 1 0 1 1 1 0 0 0 0 0 0 1 0 0 0 0
 1 0 0 0 0 0 0 0 1 1 0 0 0 1 0 0 0 1 1 1 0 0 0 0 0 0 0 0 1 0 1 0 0 0 1 0 0
 1 0 0 0 0 0 0 0 0 0 1 0 1 0 1 0 1 1 0 0 0 1 0 1 0 0 1 0 1 1 0 1 1 0 1 1 0
 0 1 0 0 1 1 1 0 0 0 0 0 1 1 0 1 0 0 0 0 0 1 0 0 0 1 0 1 0 0 1 0 1 0 0 0 0
 0 1 1 1 1 1 0 1 0 0 0]
1
2
submission_predict = np.array(submission['Survived'])
print(submission_predict)
1
2
3
4
5
6
7
8
9
10
11
12
[0 0 0 0 0 0 0 0 1 0 0 0 1 0 1 1 0 0 1 1 0 1 1 1 1 0 1 0 0 0 0 0 1 1 1 0 0
 0 0 1 0 1 0 1 1 0 1 0 1 1 1 0 1 1 0 0 0 0 0 1 0 0 0 1 1 1 1 0 0 1 1 0 1 1
 1 0 0 1 0 1 1 0 0 0 0 0 1 0 1 1 1 0 1 0 1 0 1 0 0 0 1 0 0 0 1 0 1 0 0 0 0
 1 1 1 1 0 0 1 0 1 1 0 1 0 0 0 0 1 0 0 0 1 0 0 0 0 0 0 0 0 0 1 0 0 1 0 0 0
 1 0 1 0 0 1 0 0 1 0 1 0 1 1 1 0 0 1 0 0 1 0 0 0 0 0 0 1 1 0 1 1 0 1 1 0 1
 0 1 0 0 0 0 0 1 0 1 1 1 0 0 0 1 1 1 1 0 0 1 0 1 0 0 0 0 1 1 0 1 0 1 0 1 0
 1 0 1 0 0 1 0 0 0 1 0 0 1 0 0 0 1 1 1 1 0 0 1 0 1 0 1 0 1 0 0 0 0 0 0 0 1
 0 0 0 0 1 0 0 0 0 0 0 1 0 1 1 0 1 0 0 0 0 0 1 1 0 1 0 0 1 0 0 0 0 0 0 0 0
 1 0 0 0 0 0 0 0 1 1 1 1 0 0 0 0 0 1 1 1 0 0 0 0 0 0 0 1 1 0 1 1 0 0 1 0 0
 1 0 0 0 0 0 1 0 0 0 1 1 1 0 1 0 1 1 0 0 0 1 0 1 0 0 1 0 1 1 0 1 1 0 0 1 1
 0 1 0 0 1 1 0 0 0 1 0 1 1 0 0 1 0 0 1 0 0 1 1 0 0 1 0 1 0 0 1 0 1 0 0 1 0
 0 1 1 1 1 1 0 1 0 0 1]
1
print('Survived Prediction with {:.2f}% accuracy out of total number {}'.format(100 * metrics.accuracy_score(submission_true, submission_predict), submission_true.shape[0]))
1
Survived Prediction with 83.01% accuracy out of total number 418
This post is licensed under CC-BY-NC-ND-4.0 by the author.